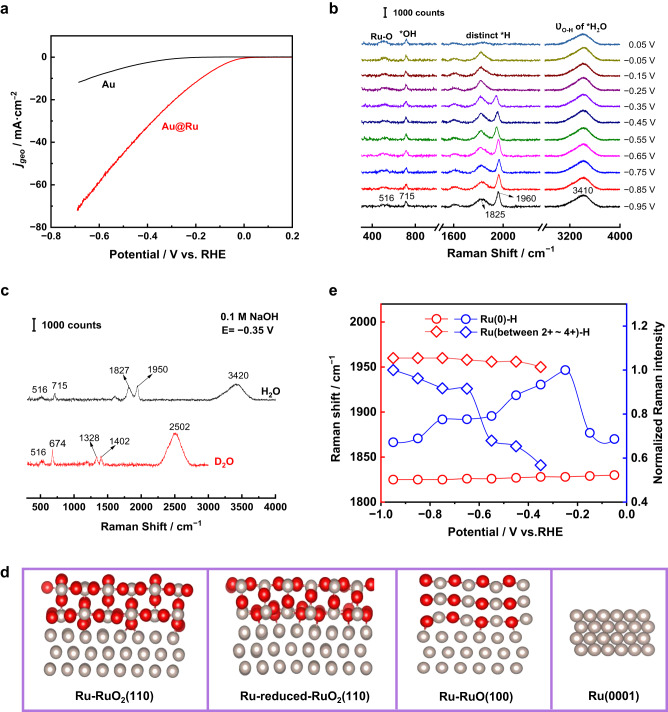
Fig. 2. Tracking alkaline HER process at Ru surfaces by in situ Raman spectroscopy and the correlated DFT results.
a Polarization curves of the HER process at 55 nm Au and 55 nm Au@2.5 nm Ru surfaces in 0.1 M NaOH (Ar-saturated) with iR correction (i, current; R, resistance), 5 mV/s scanning rate and 1600 r.p.m. b In situ Raman spectra of the alkaline HER process at 55 nm Au@2.5 nm Ru electrode surfaces. c Raman spectrum (black) and Deuterium isotopic substitution Raman spectrum (red) of the alkaline HER at 55 nm Au@2.5 nm Ru surfaces at −0.35 V. d Models of Ru-RuO2(110), Ru-reduced-RuO2(110), Ru-RuO(100), and Ru(0001) surfaces. Ru: gray spheres; O: red spheres. e Normalized Raman intensities (blue) and frequency shifts (red) of the Ru-H band at low-valence state Ru(0) (circle) and high-valence state Ru (between +2 ∼ +4) (square) surfaces in the HER potential range. The solution is 0.1 M NaOH saturated with Ar.

