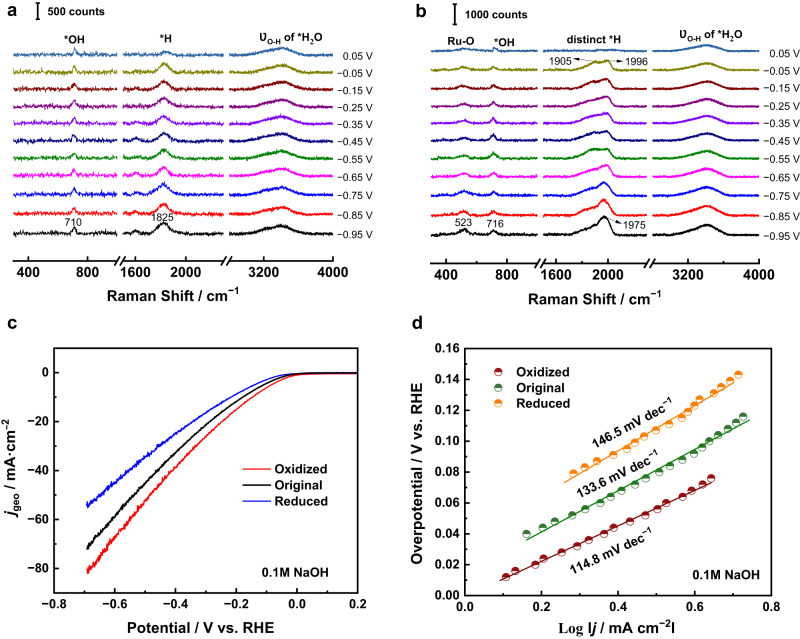
Fig. 3. In situ Raman spectra and the corresponding HER performance at Ru surfaces in different valence states.
In situ Raman spectra of the alkaline HER at 55 nm Au@2.5 nm Ru surfaces in 0.1 M NaOH after holding the potential (a) at −0.95 V for reduction for 30 mins, and (b) at +0.95 V for oxidation for 20 mins. c Polarization curves of the alkaline HER at 55 nm Au@2.5 nm Ru surfaces in different valence states in 0.1 M NaOH (Ar-saturated) with iR correction, 5 mV/s scanning rate, and 1600 r.p.m. d Corresponding Tafel plots of the HER polarization curves in (c).

