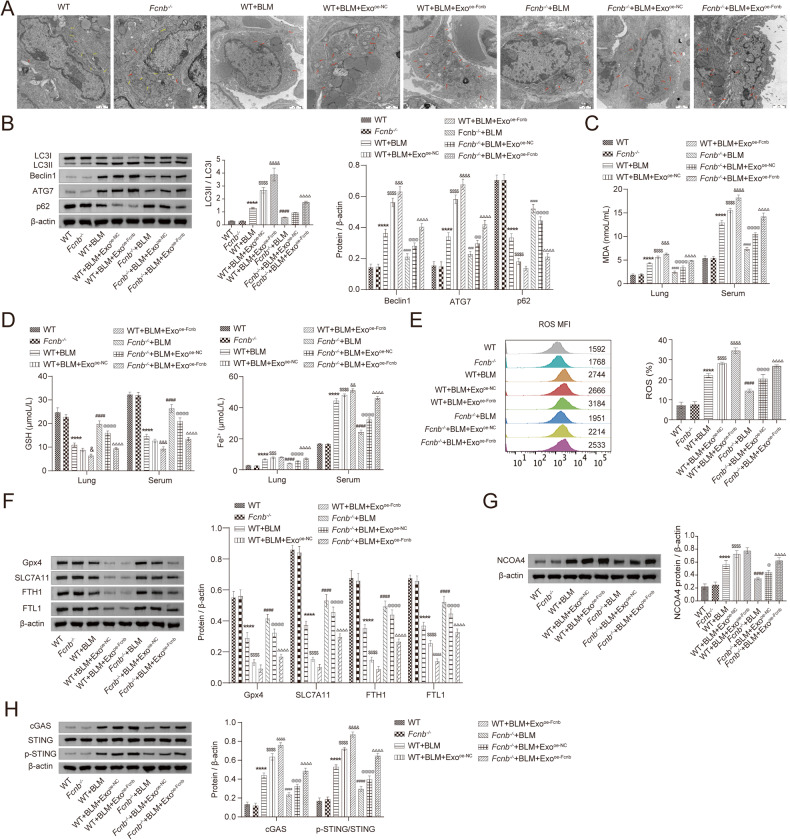
Fig. 8. Fcn B transported from AMs exosomes facilitated ferroptosis in BLM-induced mice.
A Mitochondrial damage and autophagosomes were detected by TEM (The red arrow represented damaged mitochondria). B The expressions of LC3II/LC3I, Beclin1, ATG7, and p62 in lung were detected by Western blot. C, D The concentrations of MDA, GSH, and Fe2+ in lung and serum were detected by biochemical kits. E ROS levels in lung were determined by flow cytometry. F, G The expression of GPX4, SLC7A11, FTH1, FTL1, and NCOA4 in lung were detected by Western blot. H The expressions of cGAS, STING, and p-STING in lung were detected by Western blot. The experiment was repeated three times (n = 10 mice/group). The data were presented as the mean ± SD. *WT+BLM vs. WT, *P < 0.05, **P < 0.01, ***P < 0.001, ****P < 0.0001; $WT+BLM+Exooe-NC vs. WT+BLM, $P < 0.05, $$P < 0.01, $$$P < 0.001, $$$$P < 0.0001; & WT+BLM+Exooe-Fcnb vs. WT+BLM+Exooe-NC, &P < 0.05, &&P < 0.01, &&&P < 0.001, &&&&P < 0.0001; #Fcnb-/-+BLM vs. WT+BLM, #P < 0.05, ##P < 0.01, ###P < 0.001, ####P < 0.0001; @ Fcnb-/-+BLM+Exooe-NC vs. Fcnb-/-+BLM, @P < 0.05, @@P < 0.01, @@@P < 0.001, @@@@P < 0.0001; ΔFcnb-/-+BLM+Exooe-Fcnb vs. Fcnb-/-+BLM+Exooe-NC, ΔP < 0.05, ΔΔP < 0.01, ΔΔΔP < 0.001, ΔΔΔΔP < 0.0001.

