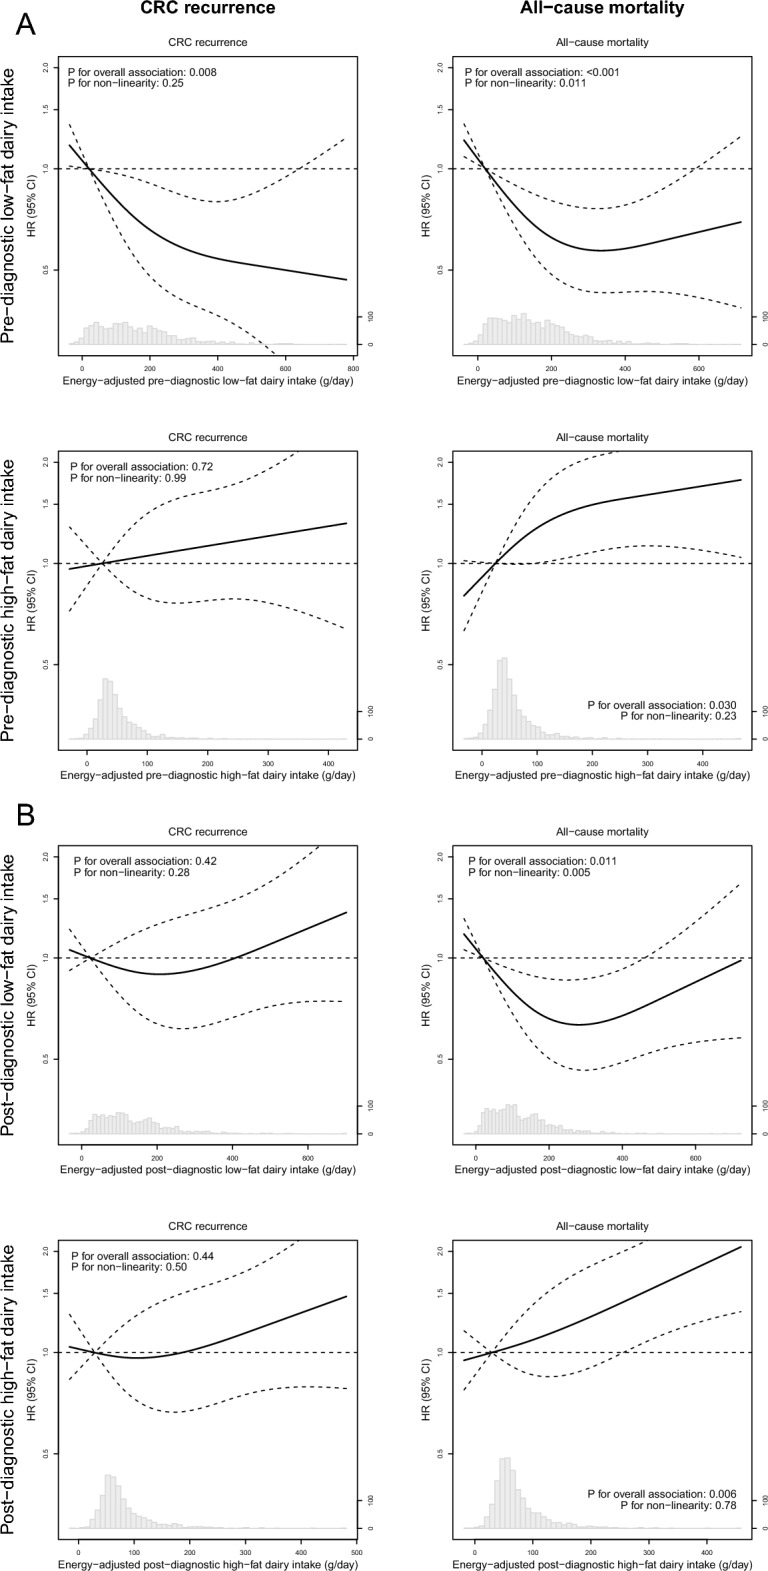
Fig. 2.

Associations between pre-diagnostic (A) and post-diagnostic (B) intake of low- and high-fat dairy and colorectal cancer prognosis. Solid lines are restricted cubic splines, and dashed lines are 95% confidence intervals. The reference values were set at the median of the first quartile of dairy intake. Knots were located at the 5th, 50th and 95th percentile, and the graphs were truncated at the 1st and 99th percentile. Analyses are adjusted for age, sex, disease stage and energy intake
