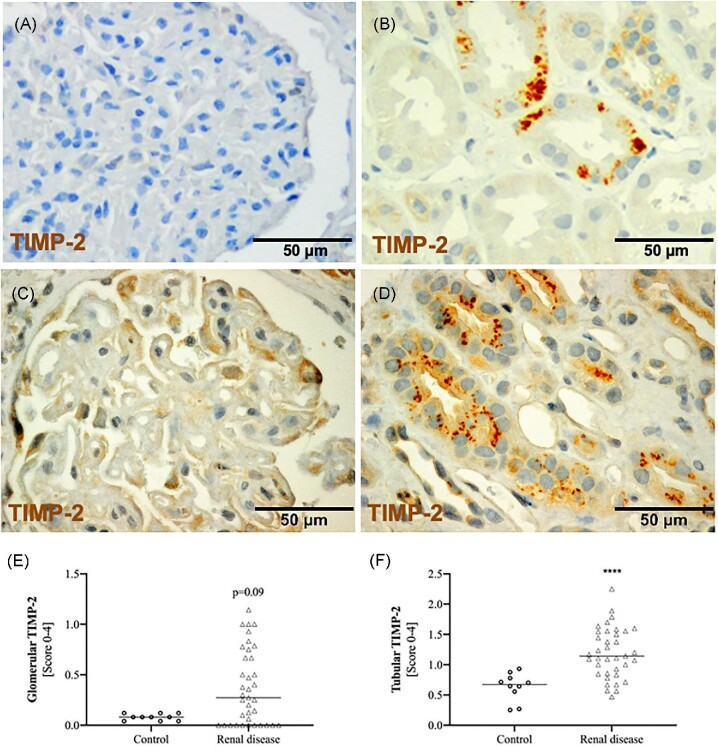
Figure 3:
Expression of TIMP-2 as assessed by immunohistochemistry in (A) a control and in biopsy examples with renal disease showing (B) moderate to (D) strong tubular as well as (C) glomerular staining. Median expression of (E) glomerular and (F) tubular TIMP-2 in controls and renal diseases are shown. ****P < .001 (Mann–Whitney U test).

