
Fig. 5: Inflammatory and profibrotic signatures of monocytes in myopericarditis.
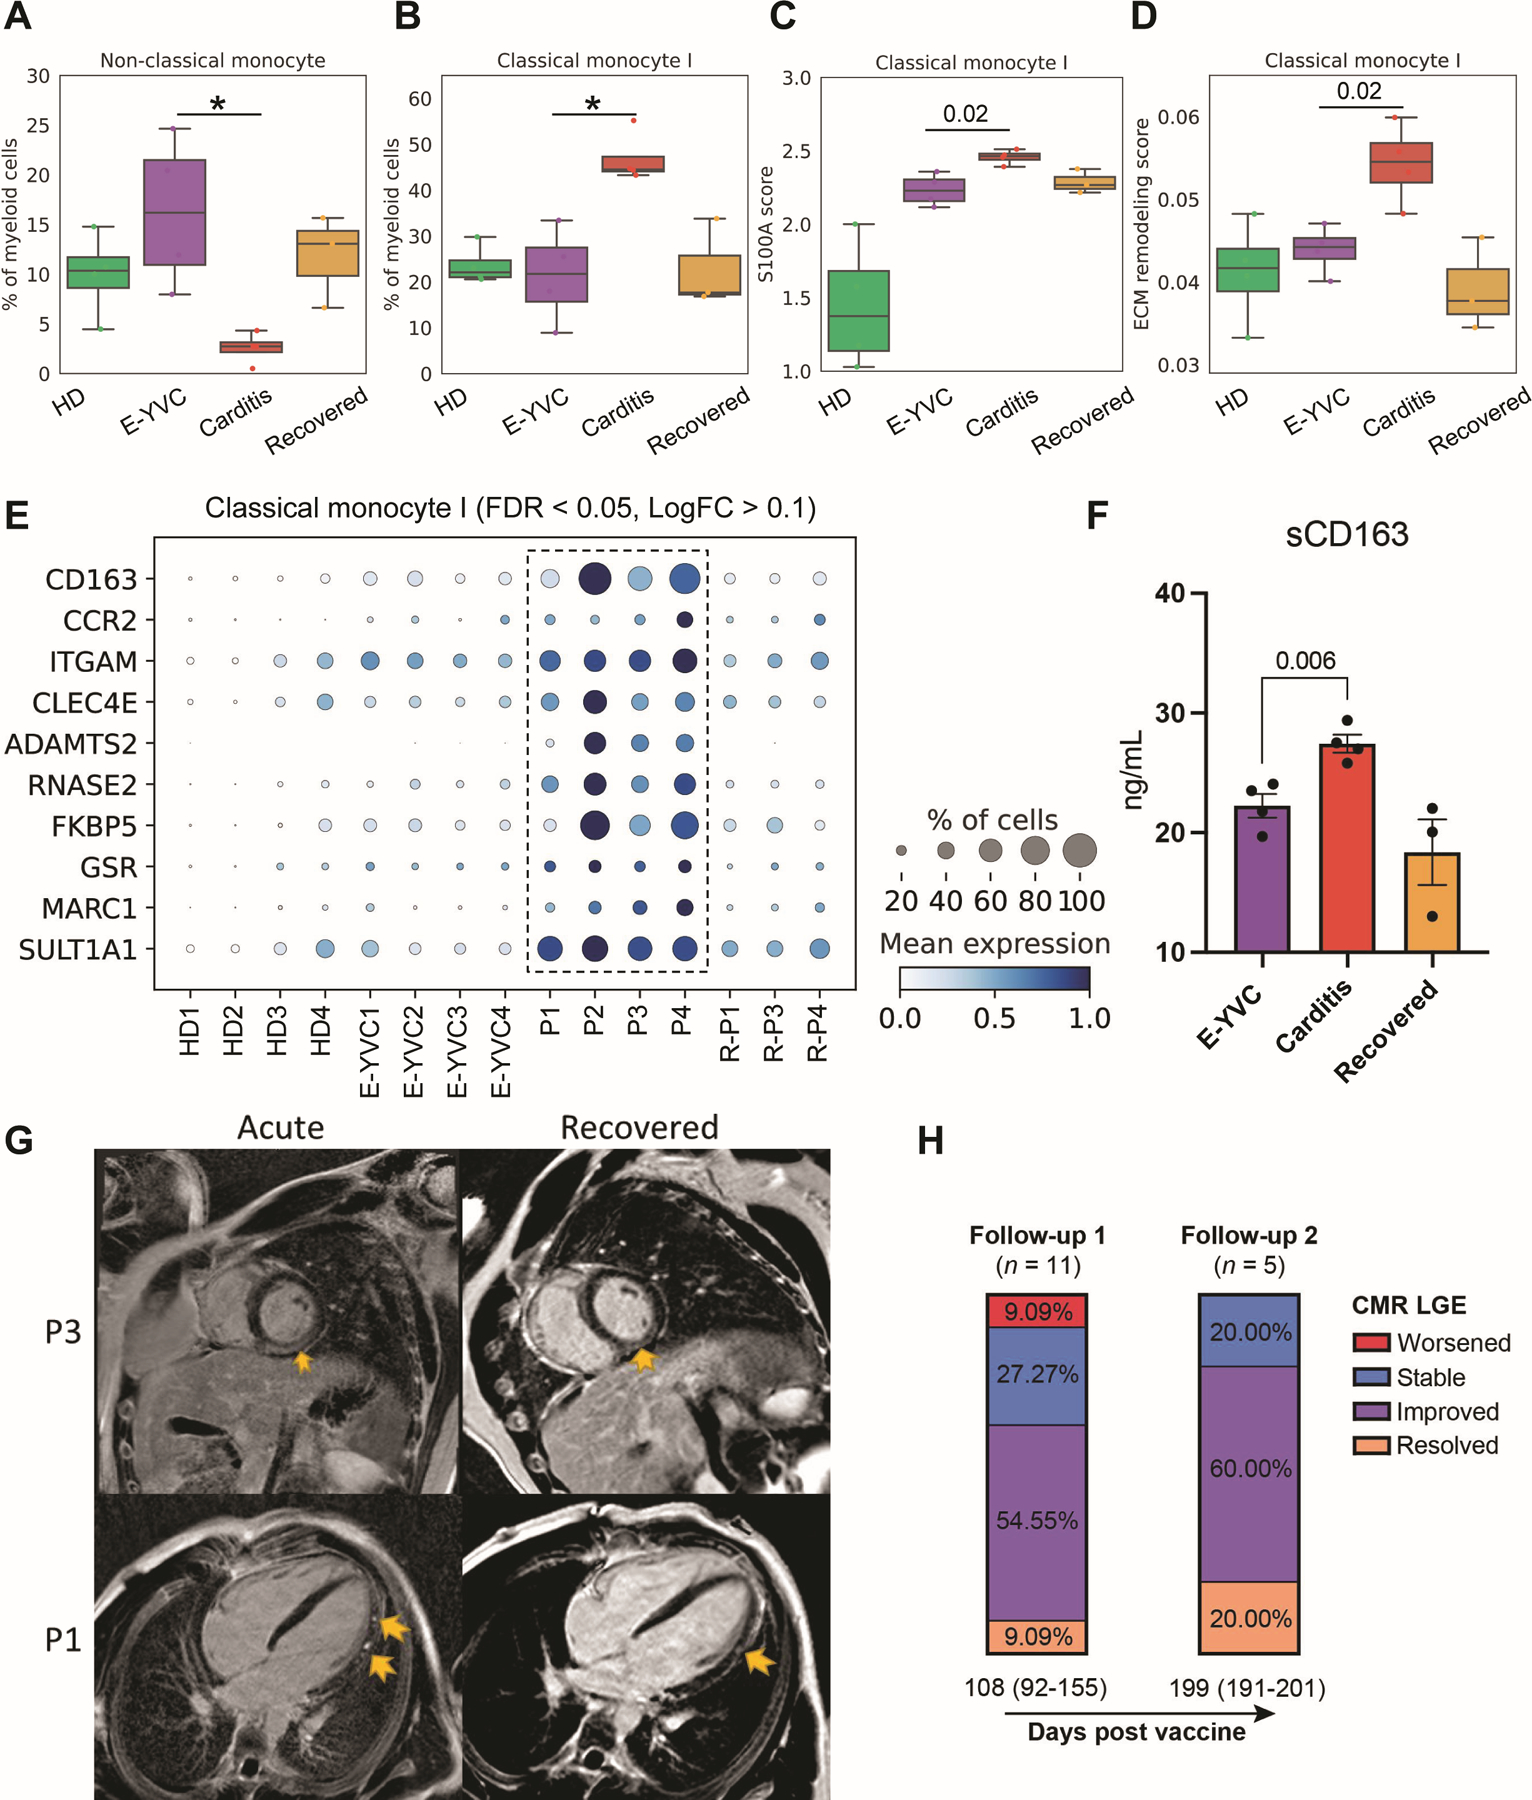
(A and B) Box plots showing the average proportions of non-classical (CD14dim CD16+) and classical (CD14+ CD16−) monocyte subsets across the groups. The boxes denote the interquartile range (IQR), horizontal bars represent the median, whiskers extend to 1.5 × IQR, and dots show the values of each donor. Statistical significance was determined using the Bayesian model scCODA (49) accounting for the compositional dependencies between cell subsets in the scRNA-seq data while controlling for false discoveries (FDR < 0.05 in myopericarditis vs. E-YVC). (C and D) Average expression score of (C) inflammatory genes from the S100A family of alarmins (S100A8–12; FDR < 0.05, LogFC > 0.1 in myopericarditis vs. E-YVC) and (D) 238 genes from a published dataset of extracellular matrix (ECM) remodeling (GSEA Molecular Signatures Database M3468) in the same classical monocyte subset shown in (B) across groups. Statistical significance between scores was determined using the unpaired two-sided Wilcoxon rank-sum test comparing the E-YVC and myopericarditis groups. (E) Dot plot showing top differentially expressed and upregulated genes in the same classical monocyte subset shown in (B) across donors (FDR < 0.05, LogFC > 0.1 in myopericarditis vs. E-YVC). (F) Enzyme-linked immunosorbent assay (ELISA) measurement of soluble CD163 (sCD163) in serum across the groups. Statistical significance was determined using the unpaired two-tailed t-test between the E-YVC and myopericarditis groups, and error bars represent the standard error (SE). (G) Representative cardiac magnetic resonance (CMR) images of acute myopericarditis and follow-up/recovery (191 days for P1 and 82 days for P3 after vaccination) showing persistent late gadolinium enhancement (LGE; yellow arrows) seen in a subset of patients (from 17 patients included in our cohort, at admission, 11 were LGE +, 4 were LGE −, and 2 had no CMR). Particularly, for P1, four chamber phase sequence inversion recovery (PSIR) demonstrating patch sub-epicardial LGE along the left ventricular lateral wall from base to apex (acute), with improvement in both quantity and intensity at follow-up (recovered). For P3, mid ventricle short axis PSIR demonstrating sub-epicardial to nearly transmural LGE sparing the sub-endocardial region (acute), which is mildly improved in intensity and quantity at follow-up (recovered). (H) Stacked bar plots depicting the percentage of patients categorized by CMR LGE changes at two follow-ups after vaccination/first admission (median days (IQR)). For exact patients with LGE at admission and follow-up as well as details of imaging findings, see Table S1.