Fig. 2.
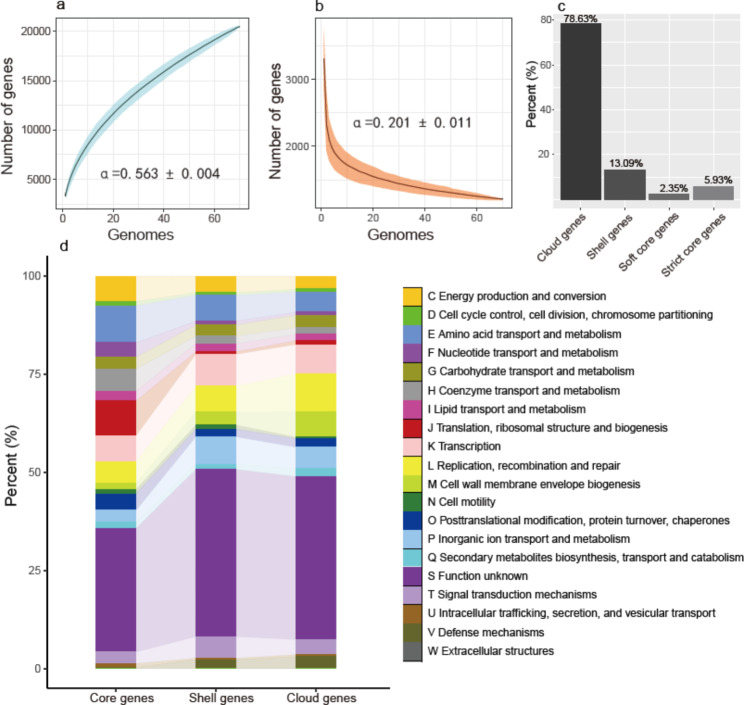
Rarefaction curves of pan and core gene numbers and summary statistics for the pangenome of Halorubrum. (a) Rarefaction curve for the accumulation of pan genes. (b) Rarefaction curve for the reduction of core genes. (c) Summary statistics for the 20,482 pan genes of Halorubrum. Cloud genes, 0% ≤ strains < 15%; shell genes, 15% ≤ strains < 95%; strict core genes, strains = 100%; soft core genes, 95% ≤ strains < 99%. The curves were fitted to median values of 1,000 permutations. The dark lines in (a) and (b) indicate median values, and the ‘shadows’ indicate the 95% confidence intervals. α = 0.564 ± 0.004 in (a) and α = 0.201 ± 0.011 in (b), indicating an open pangenome and core genome of Halorubrum. (d) Functional distribution of core genes (strict core genes plus soft core genes), shell genes and cloud genes for Halorubrum

