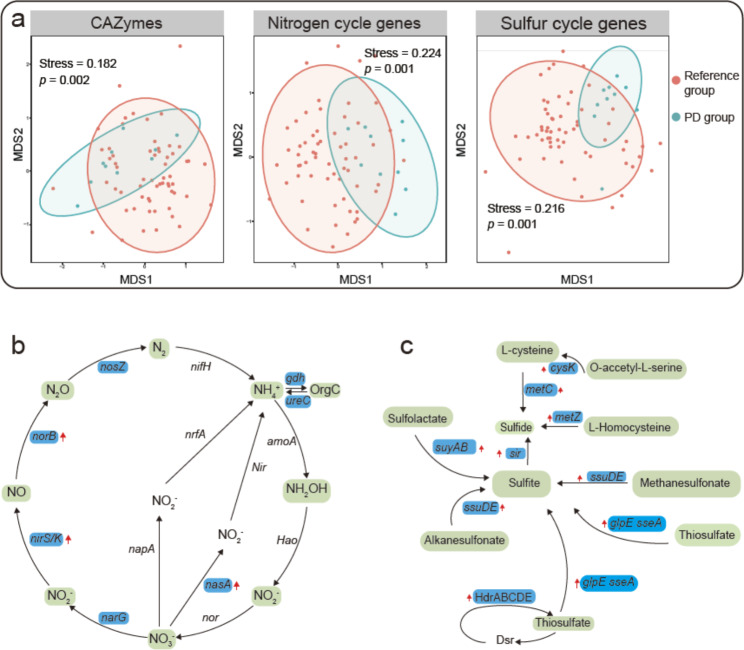
Fig. 6.
Comparison of functional capacity between the polar and deep-earth (PD) group Halorubrum and the reference group. (a) Nonmetric multidimensional scaling (NMDS) plots of CAZymes (carbohydrate-active enzymes) and nitrogen and sulfur cycling genes constructed based the Bray–Curtis dissimilarity. Analysis of the mean number of genes related to CAZymes, the nitrogen cycle and the sulfur cycle revealed a significant difference between the two groups (PERMANOVA; p < 0.05). The hulls indicate the 95% confidence intervals for a multivariate t-distribution for the respective groups of Halorubrum. (b) Summary of nitrogen cycling genes in Halorubrum; red up-arrows indicate genes that were enriched in the PD group. (c) The genes involved in organic and inorganic sulfur transformation pathways are shown in blue boxes; the red up-arrows denote the overrepresentation of these genes in the PD group Halorubrum. Modified from Yu et la., 2020. Note that the NMDS stress values of N and S cycling genes fall into the 0.2–0.3 category

