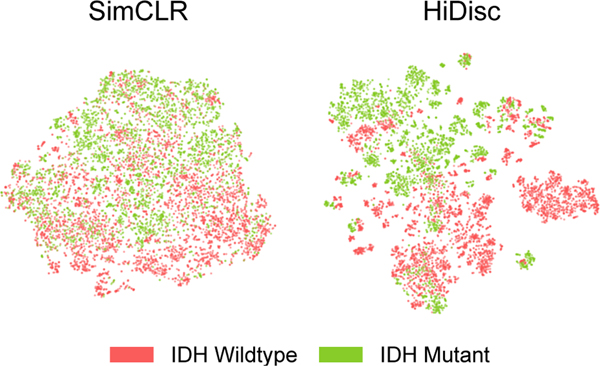
Figure 4. Visualization of learned TCGA representations using SimCLR and HiDisc.
We randomly sample patches from the validation set, and visualize these representations using [52]. Representations on the plots are colored by IDH mutational status. Qualitatively, we can observe that HiDisc forms better representations compared to SimCLR, with clusters within each mutation that corresponds to patient membership. This observation is consistent with the visualizations for the SRH dataset in Figure 3.

