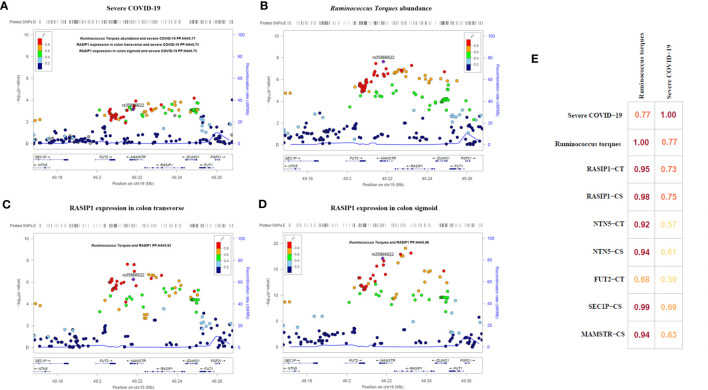
Figure 5.
Regional association plots and matrix diagram of colocalization analysis results. In (A–D) each point represents an SNP. The abscissa represents the physical position on the chromosome and the vertical axis represents the -log p value. The p values for each SNP were calculated by association analysis. (E) Colocalization matrix diagram for Ruminococcus torques, severe COVID-19 and rs35866622 related genes.

