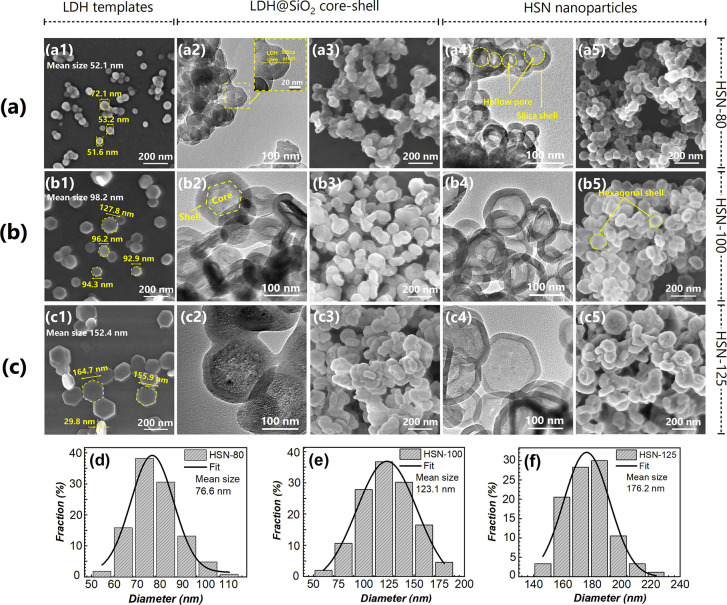
Figure 3.
FE-SEM images of LDHs (a1–c1), LDHs@SiO2 (a3–c3), HSNs (a5–c5), and TEM images of LDH@SiO2 (a2–c2), HSNs (a4–c4); the size distribution of HSN-80 (d), HSN-100 (e), and HSN-125 (f). Series pictures a, b, and c denoted for the prepared samples using LDH-80, LDH-100, and LDH-125 templates, respectively.

