Fig. 2.
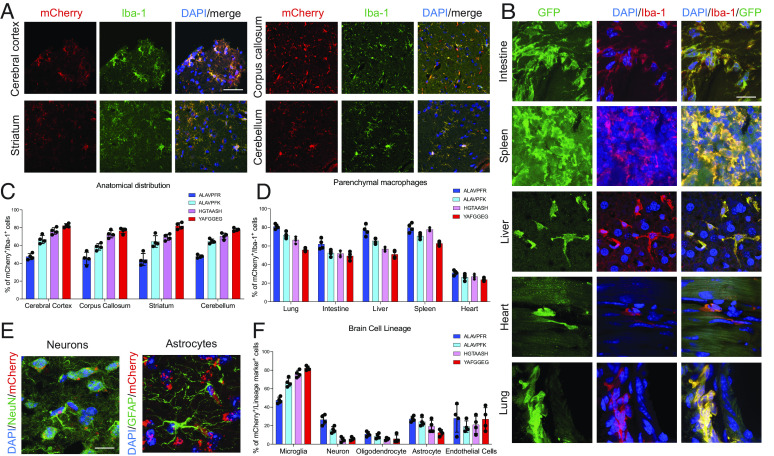
(A) Immunohistochemistry of the mouse brain labeled with Iba-1 antibody (green) and mCherry expression representing infected microglia, delivered using the HGTAASH capsid in the cerebral cortex, corpus callosum, striatum, and cerebellum. (B) Immunohistochemistry of GFP delivery using the HGTAASH capsid in the lung, intestine, liver, heart, and spleen in the context of Iba-1 labeling (red) of TRMs. (C) Quantification of mCherry+/Iba-1+ cells after systemic delivery in the cerebral cortex, corpus callosum, striatum, and cerebellum using the HGTAASH capsid. (D) Quantification of GFP+ fluorescence in Iba-1+ TRM (red) in the lung, intestine, liver, heart, and spleen. (E) Representative image of mCherry infection in neurons and astrocytes. (F) Quantification of infection of different cell lineages in the brain. Data show mean average ± SEM. (Scale bars: A, 50 µm, B, 10 µm, and E, 10 µm.)

