FIGURE 3.

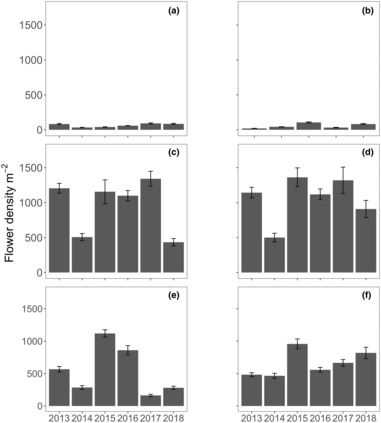
Flower densities (m2 ± SE, n = 10) measured annually in November from 2013 to 2018 for the six locations: (a) Parker Point, (b) Nancy Cove, (c) Stark Bay, (d) Crayfish Rock, (e) Catherine Point and (f) Thomson Bay at Rottnest Island.

Flower densities (m2 ± SE, n = 10) measured annually in November from 2013 to 2018 for the six locations: (a) Parker Point, (b) Nancy Cove, (c) Stark Bay, (d) Crayfish Rock, (e) Catherine Point and (f) Thomson Bay at Rottnest Island.