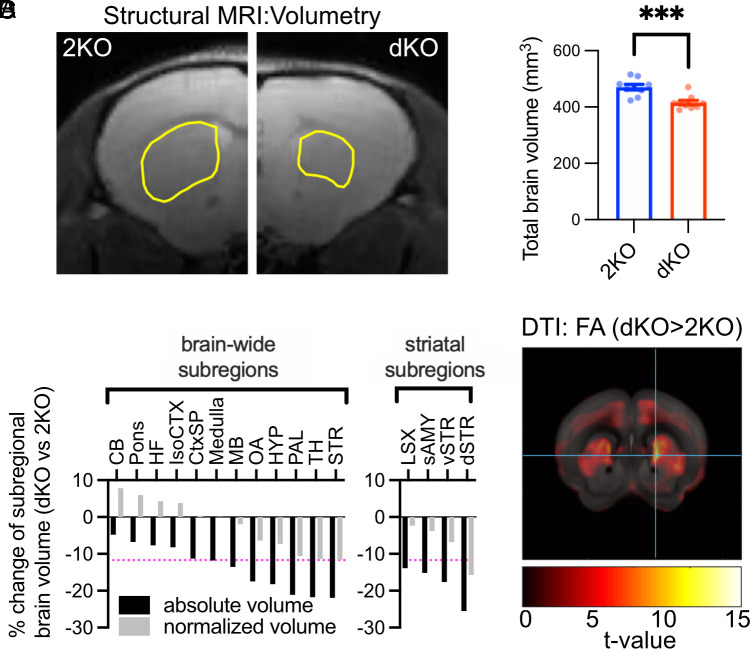
Fig. 2.
Morphological alterations of basal ganglia upon loss of ITSN1/2. (A and B) Intersectin dKO mice have smaller brains. Total brain volumes measured by MRI were compared between dKO mice and 2KO mice (A) Representative coronal optical section of one hemisphere per genotype with outlined dorsal striatum (yellow line). (B) Quantification of brain volume (N = 9 mice per genotype; unpaired two-tailed t test, ***P < 0.001). (C) dKO mice have smaller striata. Absolute (black) and normalized regional volume (gray; fraction of total brain volume) of the major brain areas (Left) and striatal subregions (Right) were compared between genotypes and expressed as percent change (dKO vs. 2KO). Detailed values are listed in SI Appendix, Tables S1 and S2. Brain structures are ordered by the degree of volume reduction. The magenta dotted line indicates the percent change of total average brain volume. CB, cerebellum; CtxSP, cortical subplate; dSTR, dorsal striatum/caudate putamen; HF, hippocampal formation; HYP, hypothalamus; isoCTX, isocortex; MB, midbrain; LSX, lateral septal complex; OA, olfactory areas; PAL, pallidum, sAMY, striatum-like amygdalar nuclei; STR, striatum; TH, thalamus; vSTR, ventral striatum. (D) dKO mice show microstructural changes in the striatum as measured by DTI. Depiction of color-coded t-values of fractional anisotropy (FA) changes in dKO vs. 2KO mice. The detailed voxel-based statistics of FA and axial diffusivity (AD) can be found in SI Appendix, Fig. S2 and Tables S3 and S4.

