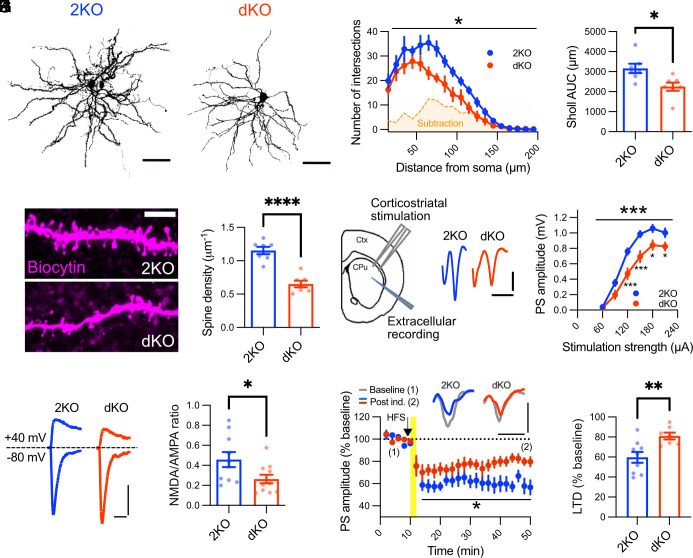
Fig. 3.
Impaired neuronal morphology and synaptic function in intersectin dKO mice. (A–C) Intersectin dKO medium spiny neurons are less complex. Maximum intensity projections of biocytin-filled medium spiny neurons from dKO and 2KO mice were thresholded and used to create binary masks for Sholl analysis (A). (B) Two-dimensional Sholl analysis of biocytin-filled neurons. dKO neurons have significantly fewer branches, as visualized by the subtracted area (2KO–dKO, orange shading). Data are shown as the mean number of intersections at 10 μm radial steps from the soma, starting from 15 μm and ending at 195 μm (N = 7 cells from at least 3 animals per genotype, two-way RM ANOVA, genotype effect: *P < 0.05). (C) The number of dendritic intersections from B was integrated over the complete radial distance under analysis to compare total dendritic intersections between genotypes (N = 7 cells from at least 3 animals per genotype, unpaired two-tailed t test *P < 0.05). (D and E) dKO medium spiny neurons exhibit a decreased spine density. (D) Maximum intensity projections of dendritic segments filled with biocytin. Note how dKO dendritic segments possess fewer spines on their dendritic branches. (E) Quantification of spine density (N = 7 cells from at least 3 animals per genotype, unpaired two-tailed t test ****P < 0.0001). (F and G) Disturbed basal cortico-striatal transmission in dKO mice. (F) Scheme of electrode placement and representative population spikes evoked with 180 μA stimulation strength in dorsolateral striatum. (G) Population spike amplitudes are significantly smaller in the dKO striatum (2KO: 22 slices from 5 animals, dKO: 21 slices from 5 animals; two-way RM-ANOVA, genotype effect: ***P < 0.001; followed by Holm–Sidak multiple comparison test, *P < 0.05, ***P < 0.001). (H and I) Decreased NMDA/AMPA current ratios in intersectin dKO medium spiny neurons. (H) Representative traces of NMDAR- and AMPAR-mediated currents measured by whole-cell voltage clamp. (I) Quantification of NMDA/AMPA current ratios (2KO: 10 cells from 4 animals, dKO: 11 cells from 4 animals; unpaired two-tailed t test, *P < 0.05). (J and K) Impaired long-term depression in dKO medium spiny neurons. (J, Top) Average population spikes during first 10 min baseline transmission (gray) and during the last 10 min of the experiment (colored). (Below) Quantification of population spike amplitude as % of initial 10 min baseline. The arrow and yellow line indicate onset and duration of high-frequency stimulation, respectively (2KO: 9 slices from 3 animals, dKO: 7 slices from 3 animals; two-way RM-ANOVA, genotype effect: *P < 0.05). (K) The efficiency of long-term depression was compared by quantification of values of the last 10 min from J (2KO: 9 slices from 3 animals, dKO: 7 slices from 3 animals; unpaired two-tailed t test, **P < 0.01).

