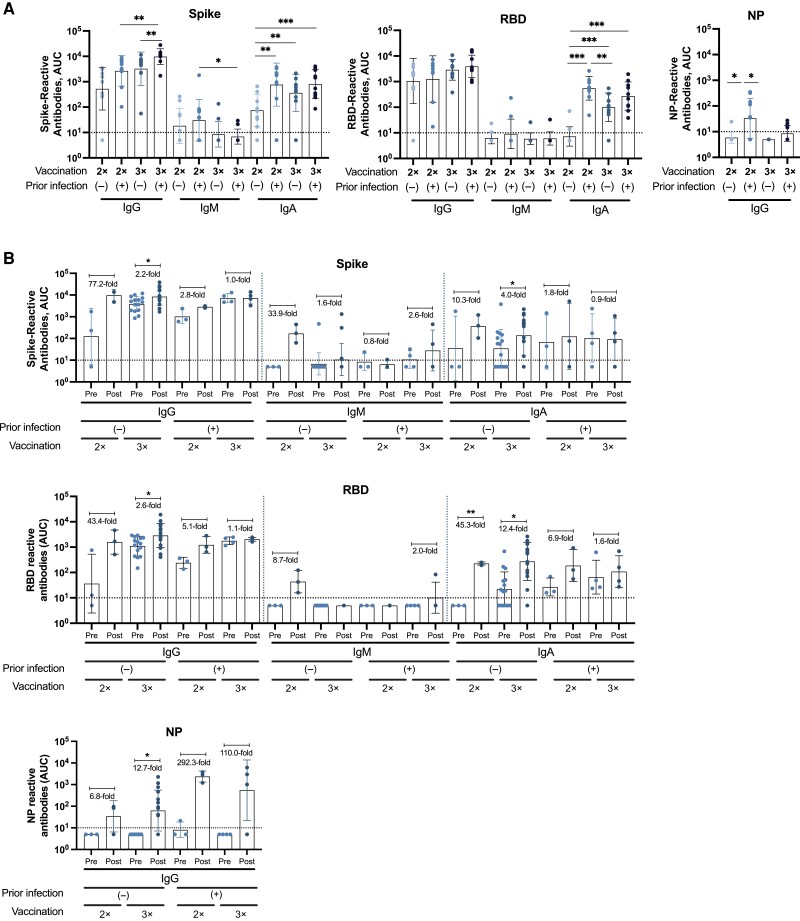
Figure 4.
Binding profile of antibodies against Wuhan-1 antigens from individuals in the “vaccination” and “breakthrough infection” groups. Immunoglobulin (Ig) G, IgM, and IgA antibody levels against wild-type (WT) spike, WT receptor-binding domain (RBD), and WT nucleoprotein (NP) antigens, expressed as the area under the curve (AUC), are shown for the vaccination (n = 40) (A) and breakthrough infection (n = 25) (B) groups. The limit of detection is indicated by the horizontal dotted lines. WT refers to the sequence of the original Wuhan-Hu-1 severe acute respiratory syndrome coronavirus 2 (SARS-CoV-2) isolate. Analyses were performed using a Mann-Whitney U test for comparisons among different groups (A), and a parametric paired t test for comparing prebreakthrough (Pre) and postbreakthrough (Post) infection responses (B). The average fold change occurring with breakthrough infection is indicated for each Pre-Post pair, represented by dots. *P < .03; **P < .002; ***P < .001. Each symbol represents a single participant; bars, geometric means; and error bars, geometric standard deviations.

