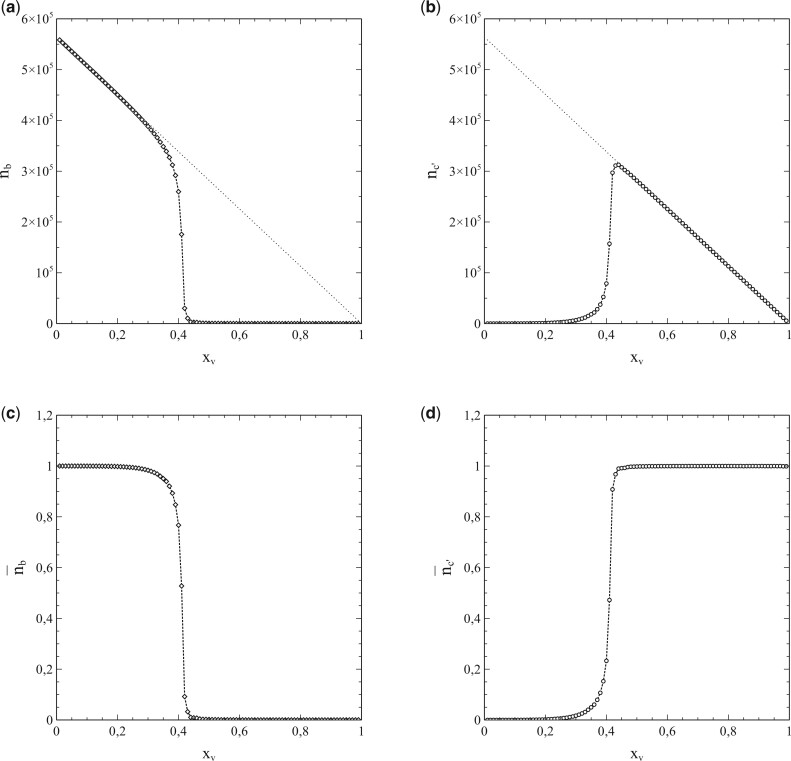
Figure 20:
Variation of nb (a) and (b) with xv as obtained from simulations for a 751 × 751 square lattice with nearest neighbour interactions. Dotted lines represent the total number of susceptibles. Panels (c) and (d): resulting variations of (c) and (d) with xv obtained from the data represented in (a) and (b), respectively.

