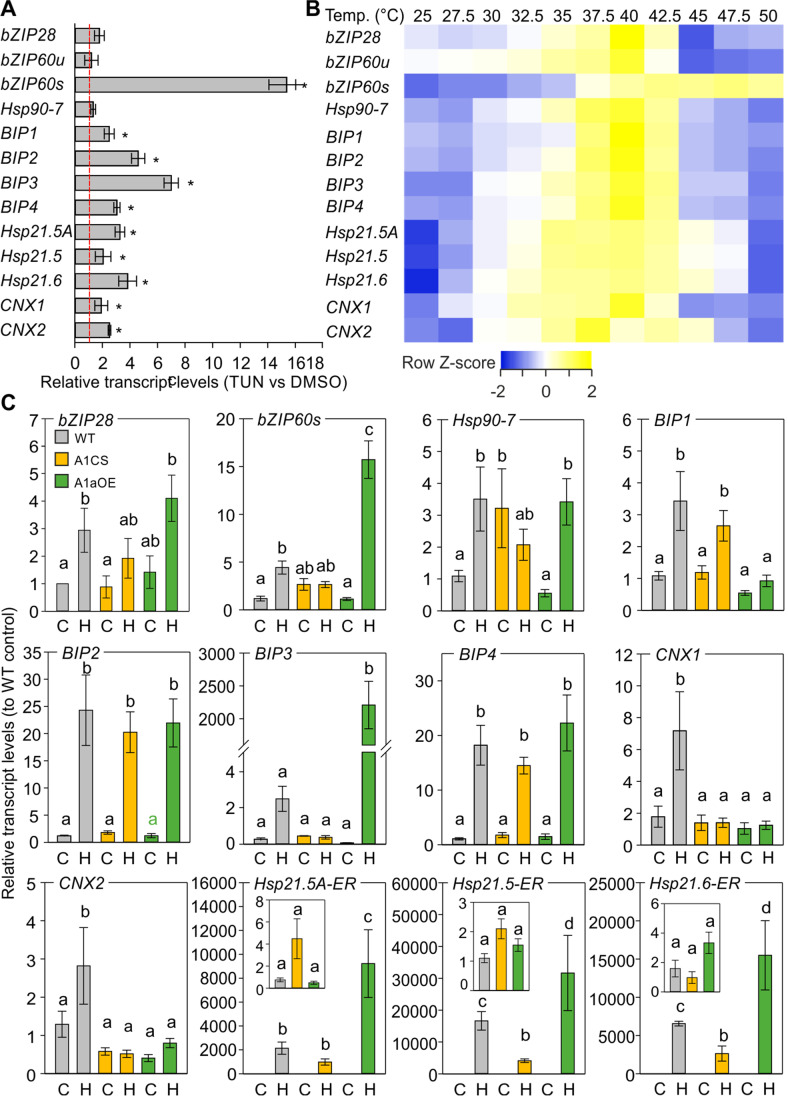
Fig. 3.
Transcript level of ER chaperones and UPR genes in response to tunicamycin or heat stress treatments. Relative transcript levels of selected genes in leaves treated with A TUN (50 ng mL−1) for 2 h or DMSO (control), B different temperatures for 1 h. Results are presented in A as 2−ΔΔ.Ct or in B and C as − ΔΔCt. The asterisk indicates statistically significant difference based on Student’s t-test (p < 0.05). DMSO control onefold value is presented as a red line. C Relative transcript levels of ER-UPR genes in WT, A1CS, and A1aOE leaves exposed for 1 h at 40 °C (“H”) or 25 °C as control (“C”). Expression levels are expressed as relative to WT control. Bars are the average of three independent experiments, ± SEM. Different letters denote statistically significant differences based on one-way ANOVA with Duncan’s multiple range test (p < 0.05)

