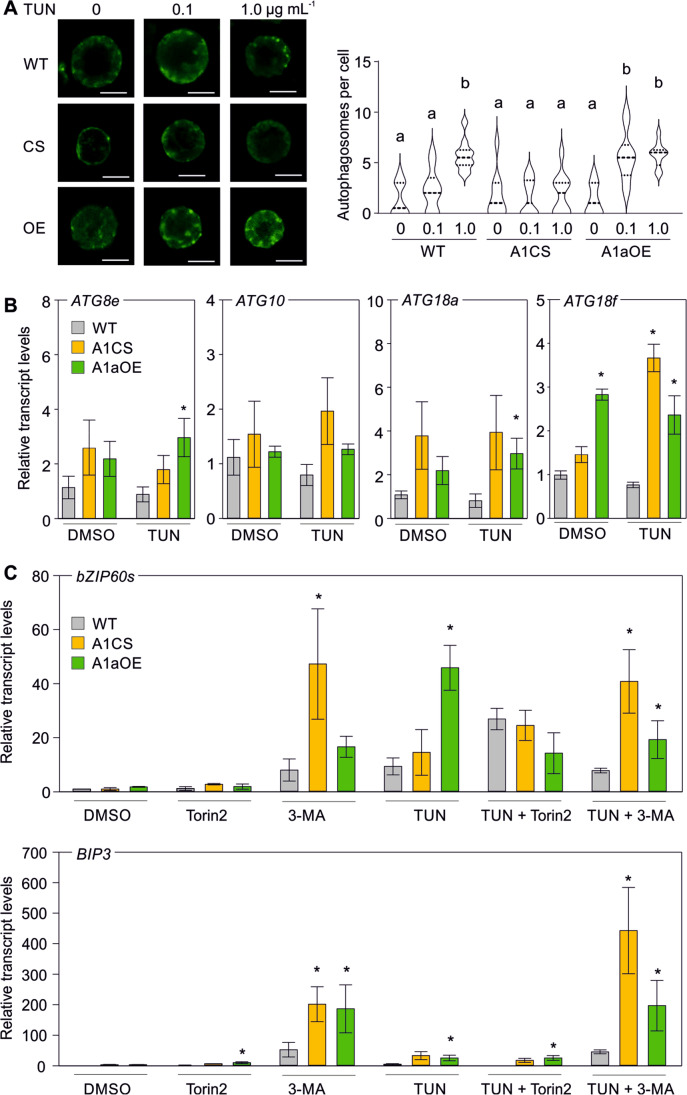
Fig. 8.
Regulation of ER stress–induced autophagy by HsfA1a. A Detection of MDC-stained autophagosomes of protoplasts from WT, A1CS, and A1aOE leaves treated with 0.1 or 1.0 μg mL−1 TUN or DMSO for 3 h. Bar is 10 μm. On the right, the number of autophagosomes detected in the same samples as in panel A is given. Violin plots from 10 cells for each sample. Different letters denote statistically significant differences based on ANOVA test and post hoc Duncan’s multiple range test (p < 0.05). B Transcript levels of ATG genes in WT, A1aOE, and A1CS treated with DMSO or TUN. C Transcript levels of BIP3 and bZIP60s in WT, A1CS, and A1aOE treated with DMSO or TUN as well as with 3-MA and Torin2. qRT-PCR values are the average of 3 biological replicates ± SEM. Asterisks denote statistically significant difference with the WT of the same treatment (*p < 0.05) based on t-test

