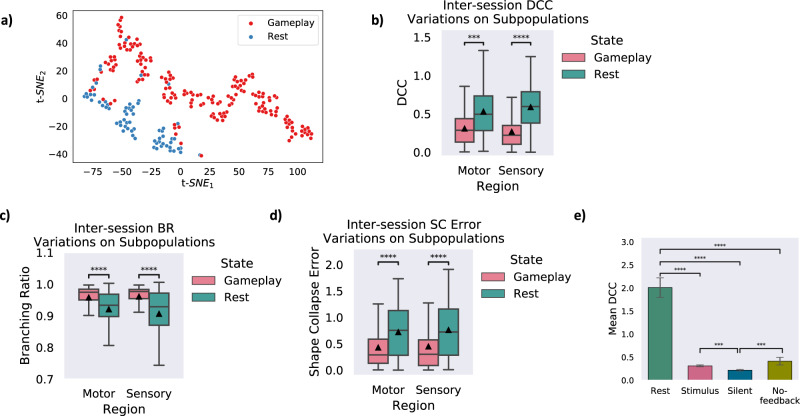
Fig. 4. Critical dynamics are observed in subpopulations of neurons during Gameplay but not Rest and in different feedback conditions.
a) Visualization of the extracted representation for each data point using the t-SNE algorithm in a 2-dimensional space (i.e., dimensions t-SNE1 and t-SNE2). The two Rest and Gameplay classes are illustrated with different colors. b) DCC, c) BR, and d) SC error variations between Rest and Gameplay sessions in separate motor and sensory regions of the cultures. The illustrated trend in all three measures on the subpopulations is in line with the previous conclusion about the entire population. A similar pattern in these results also states that during Gameplay the neuronal ensembles move near criticality while in Rest, they are further from a critical state. ***p < 10−3, ****p < 10−5. Box plots show interquartile range, with bars demonstrating 1.5X interquartile range, the line marks the median and the black triangle marks the mean. Error bands, 1 SE. The sample sizes of the box and bar plots are equal to the number of independent Gameplay recordings (n = 192) and Rest recordings (n = 116). Alexander-Govern approximation test with p = 8.172e − 4, p = 8.839e − 6, and p = 7.139e − 6 for DCC, BR, and SC error in the motor region and p = 5.627e − 12, p = 4.637e − 7, and p = 1.442e − 6 for DCC, BR, and SC error in the sensory region in Gameplay vs Rest. e) Comparing the average DCC measure calculated in different feedback conditions with the Rest sessions. ***p < 5 × 10⁻³, ****p < 10−10. Error bars, SEM. The sample sizes of the bar plots are the number of independent recordings during Rest or different feedback conditions, that is n = [209, 113, 119, 95] for Rest, Stimulus, Silent, and No-feedback. Source data are provided as a Source Data file.

