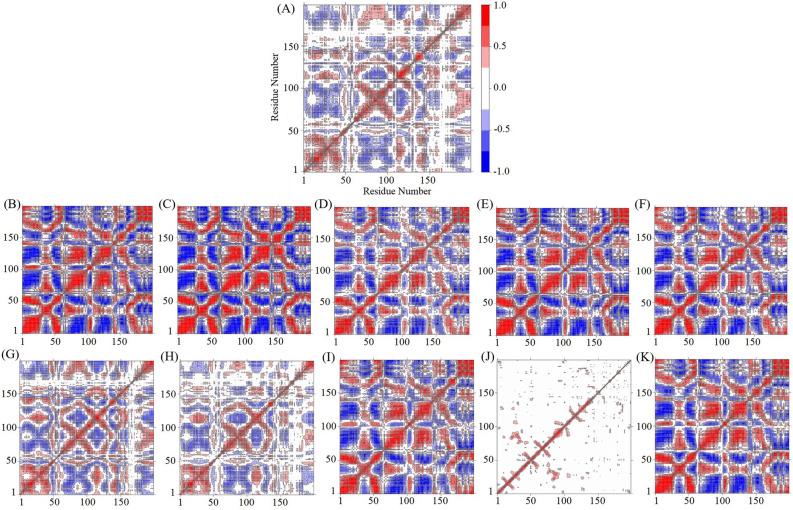
Figure 8.
Comparison of cross-correlation matrices of wild-type and mutant proteins. Cross correlation matrix of C-alpha atoms during 50 ns simulation for wild-type protein (A) and mutant proteins of 1A9M (B), 1AAQ (C), 1AXA (D), 1GNM (E), 1GNN (F), 1MES (G), 1MET (H), 1ODX (I), 1ODY (J), and 1PRO (K). The range of motion is shown by different colors in the panel. Red color denotes positive correlation whiles blue color denotes anti-correlation.

