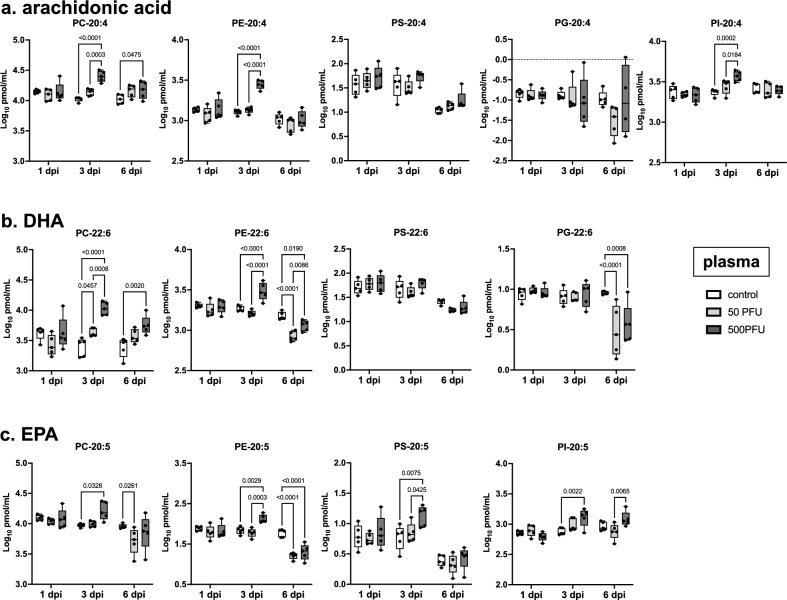
Figure 4.
Concentrations of phospholipids containing 20:4, 22:6, or 20:5 in the plasma. Male C57BL/6 mice were intranasally inoculated with PBS control or PBS comprising PR8 virus (50 or 500 PFU), and lipidome analyses were performed with plasma samples collected at 1, 3, and 6 dpi (n = 5 mice). Log-transformed concentrations of phospholipids containing (a) 20:4 (arachidonic acid), (b) 22:6 (DHA), and (c) 20:5 (EPA) in the plasma samples are shown here. In each panel, dots represent individual values, the box shows the interquartile range, the horizontal line within the box shows the median value, and the whiskers/vertical lines show maximum (top) and minimum (bottom) values. White, light gray, and dark gray boxes indicate data from PBS control, and 50 or 500 PFU of PR8 virus-infected mice, respectively. Two-way ANOVA using a multiple comparison correction. PR8 influenza virus A/Puerto Rico/8/34, PFU plaque-forming unit, dpi day-post-infection, DHA docosahexaenoic acid, EPA eicosapentaenoic acid, PC phosphatidylcholine, PE phosphatidylethanolamine, PG phosphatidylglycerol, PI phosphatidylinositol, PS phosphatidylserine.

