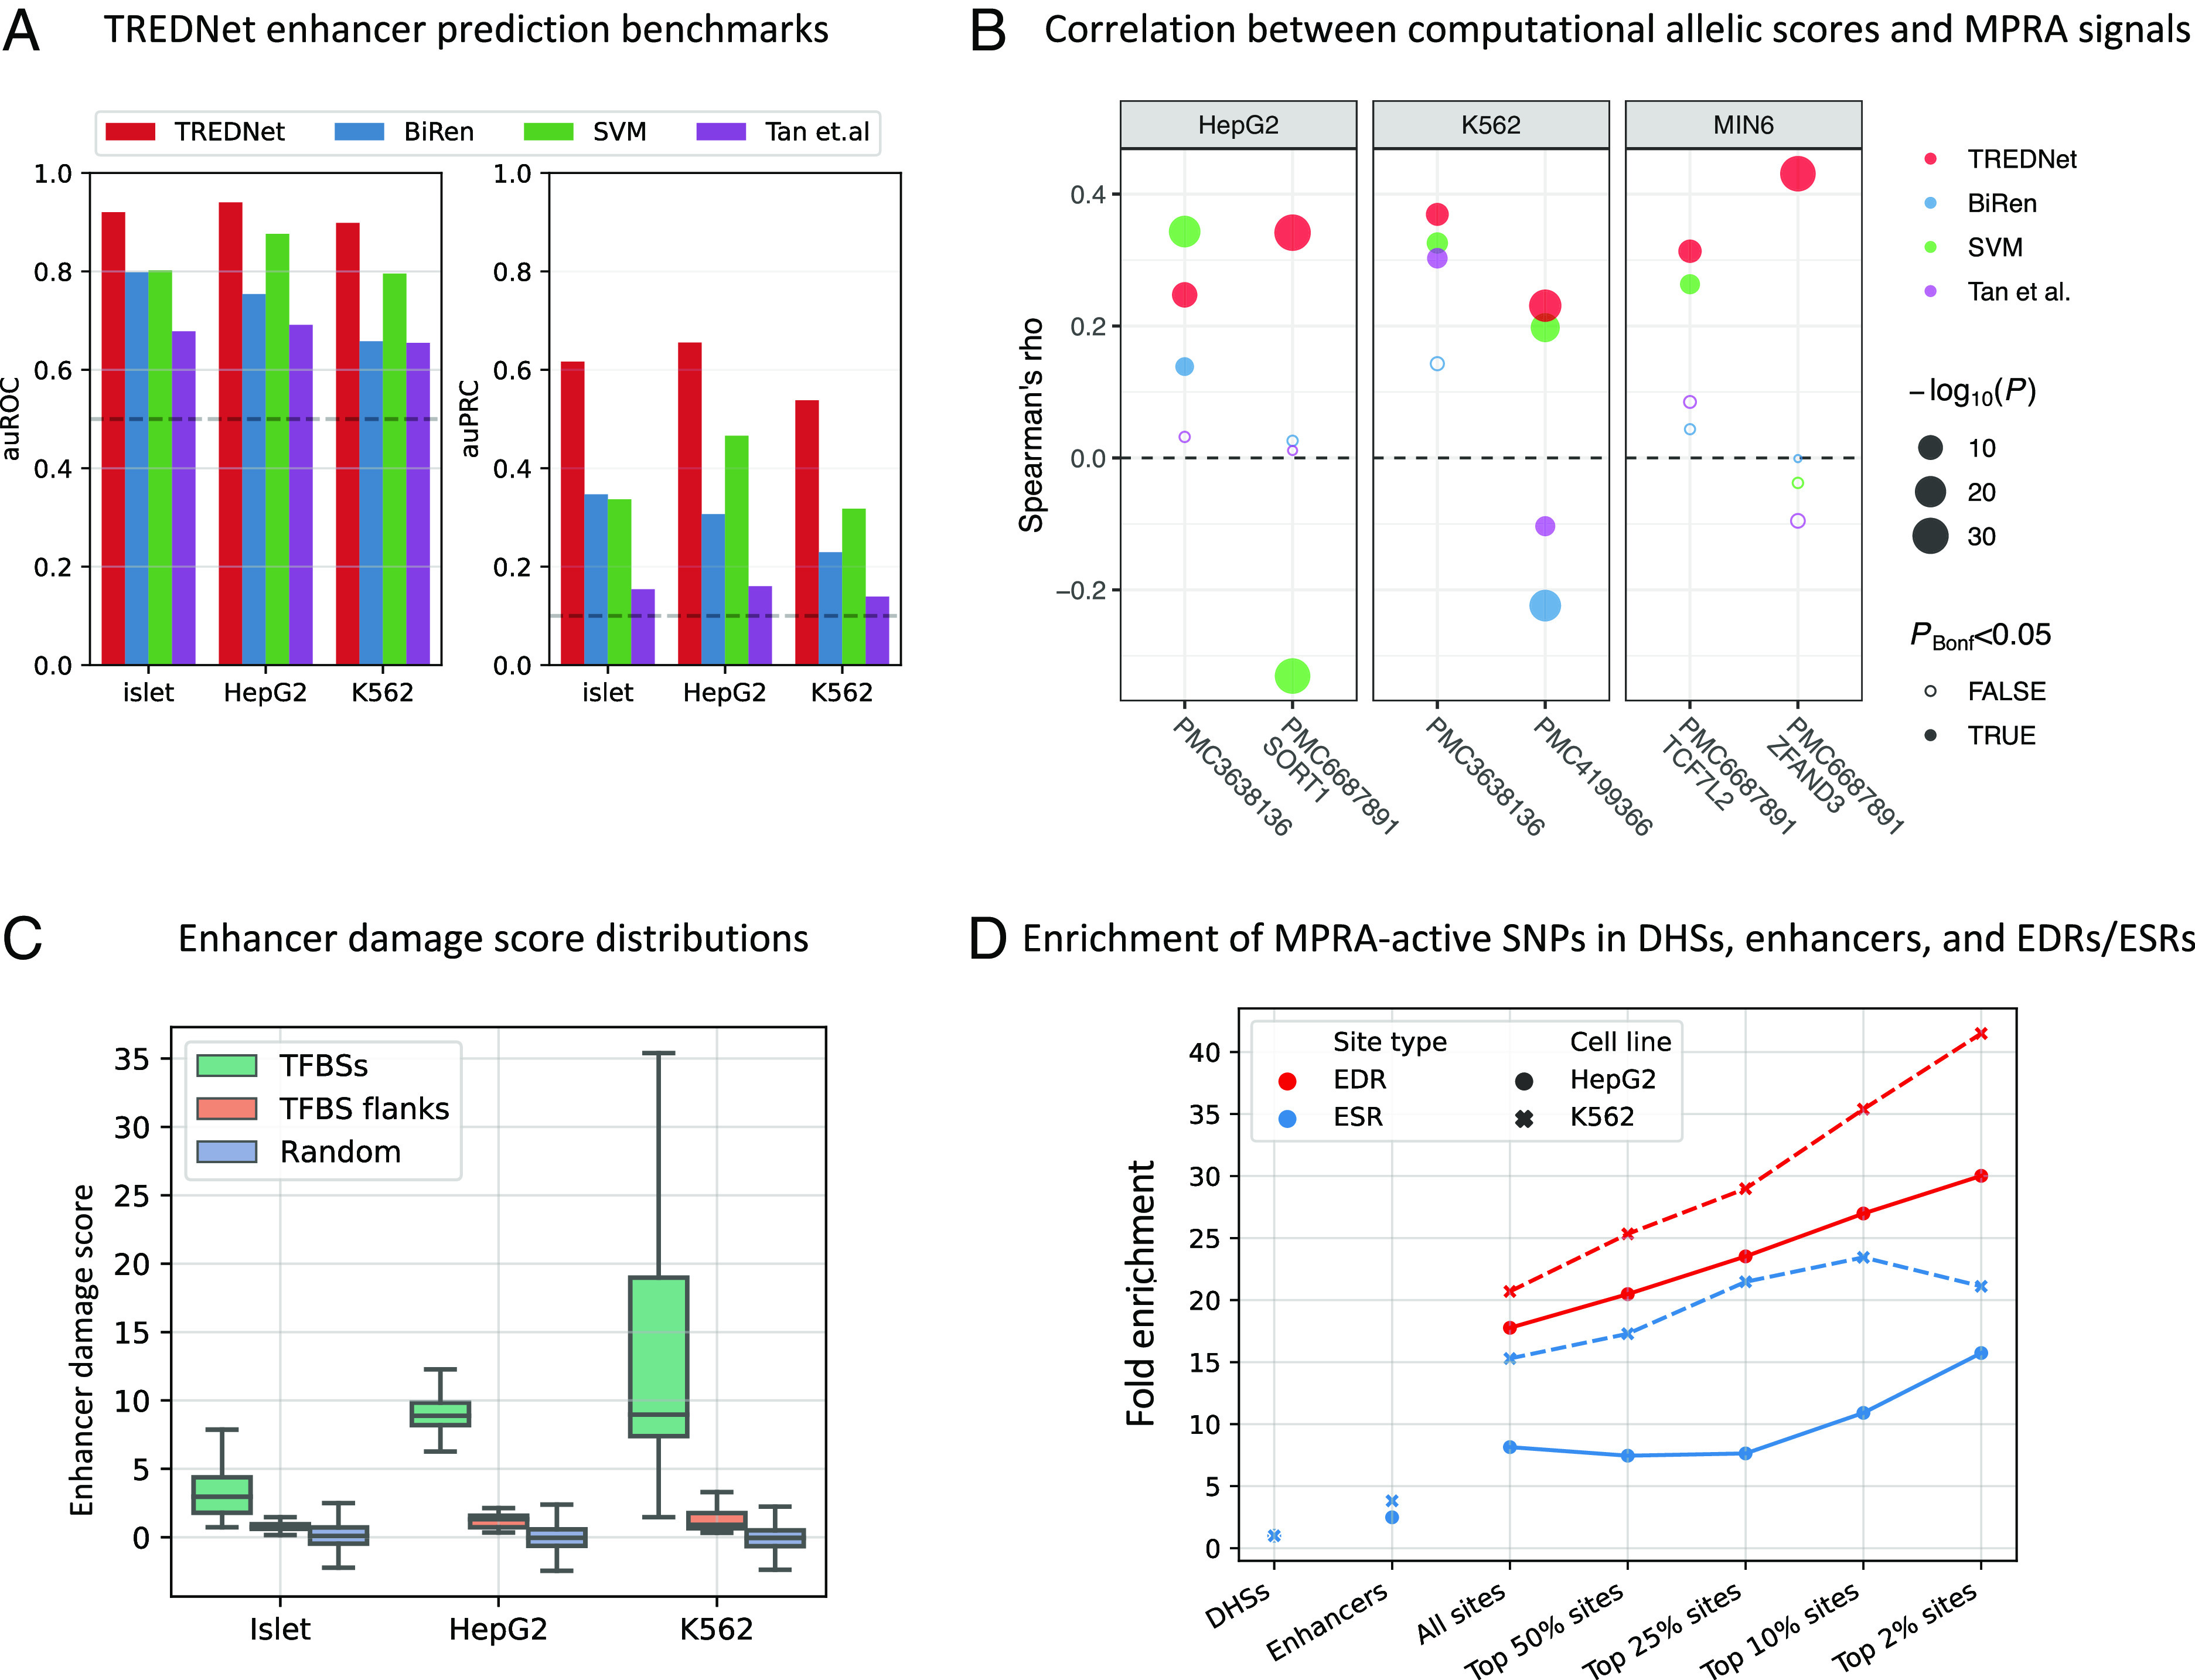
Fig. 2.

Characterization of TREDNet, TREDNet ED scores, and EDRs/ESRs. (A) Phase two TREDNet enhancer prediction accuracy across biospecimens (x axis) compared to other models (colors) using auROC (Left) and area under the precision recall curve (auPRC; Right) metrics (y axis). Dashed horizontal lines show the performance of a random classifier: auROC = 0.5 and auPRC = 0.09. (B) Correlation (Spearman’s rho; y axis) between predictions of computational methods (colors) and MPRA signals from different experiments (x axis; coded using PubMed Central identifiers) across biospecimens (facets). (C) Distribution of TREDNet ED scores (y axis) in TFBSs, TFBS flanking regions, and random genomic regions outside of TFBSs (colors) across biospecimens (x axis). (D) Enrichment (y axis) of active SNPs from HepG2 and K562 MPRA experiments (point shape and linetype) in EDRs/ESRs (colors), enhancers, and DHSs (x axis). EDRs/ESRs are binned into five groups by their average ED scores.
