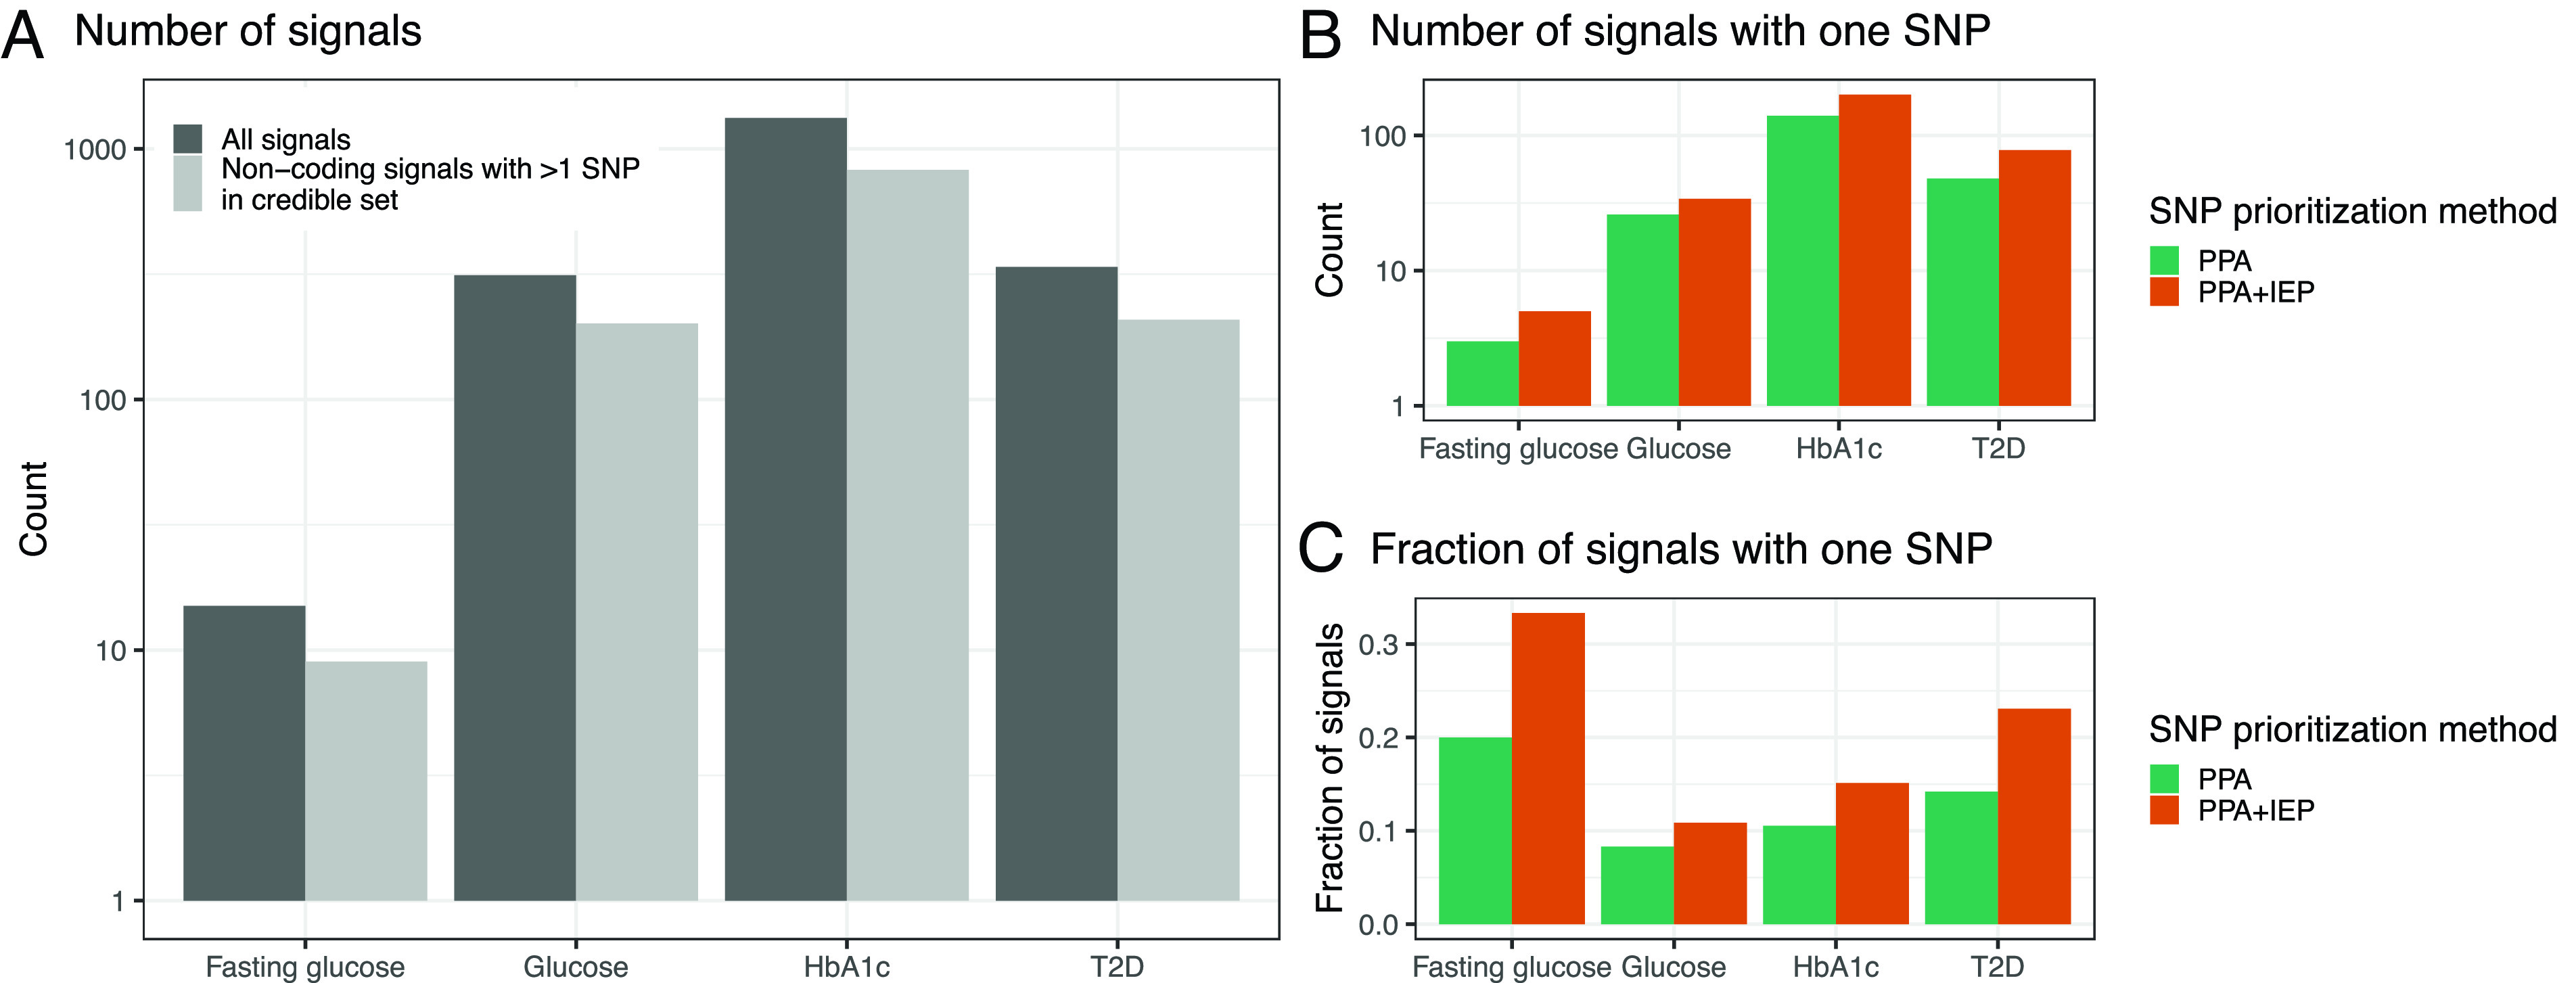
Fig. 4.

Results of IEP ratio1:2 prioritization of credible set SNPs. (A) Total number of independent signals (y axis) for each disease/trait considered (x axis). (B) Number of signals with one SNP (y axis) in the 95/99% credible set before (green) and after applying the IEP ratio1:2 SNP prioritization method (orange) for each disease/trait considered (x axis). PPA stands for posterior probability of association. (C) Fraction of signals with one SNP (y axis) in the 95/99% credible set before (green) and after applying the IEP ratio1:2 SNP prioritization method (orange) for each disease/trait considered (x axis).
