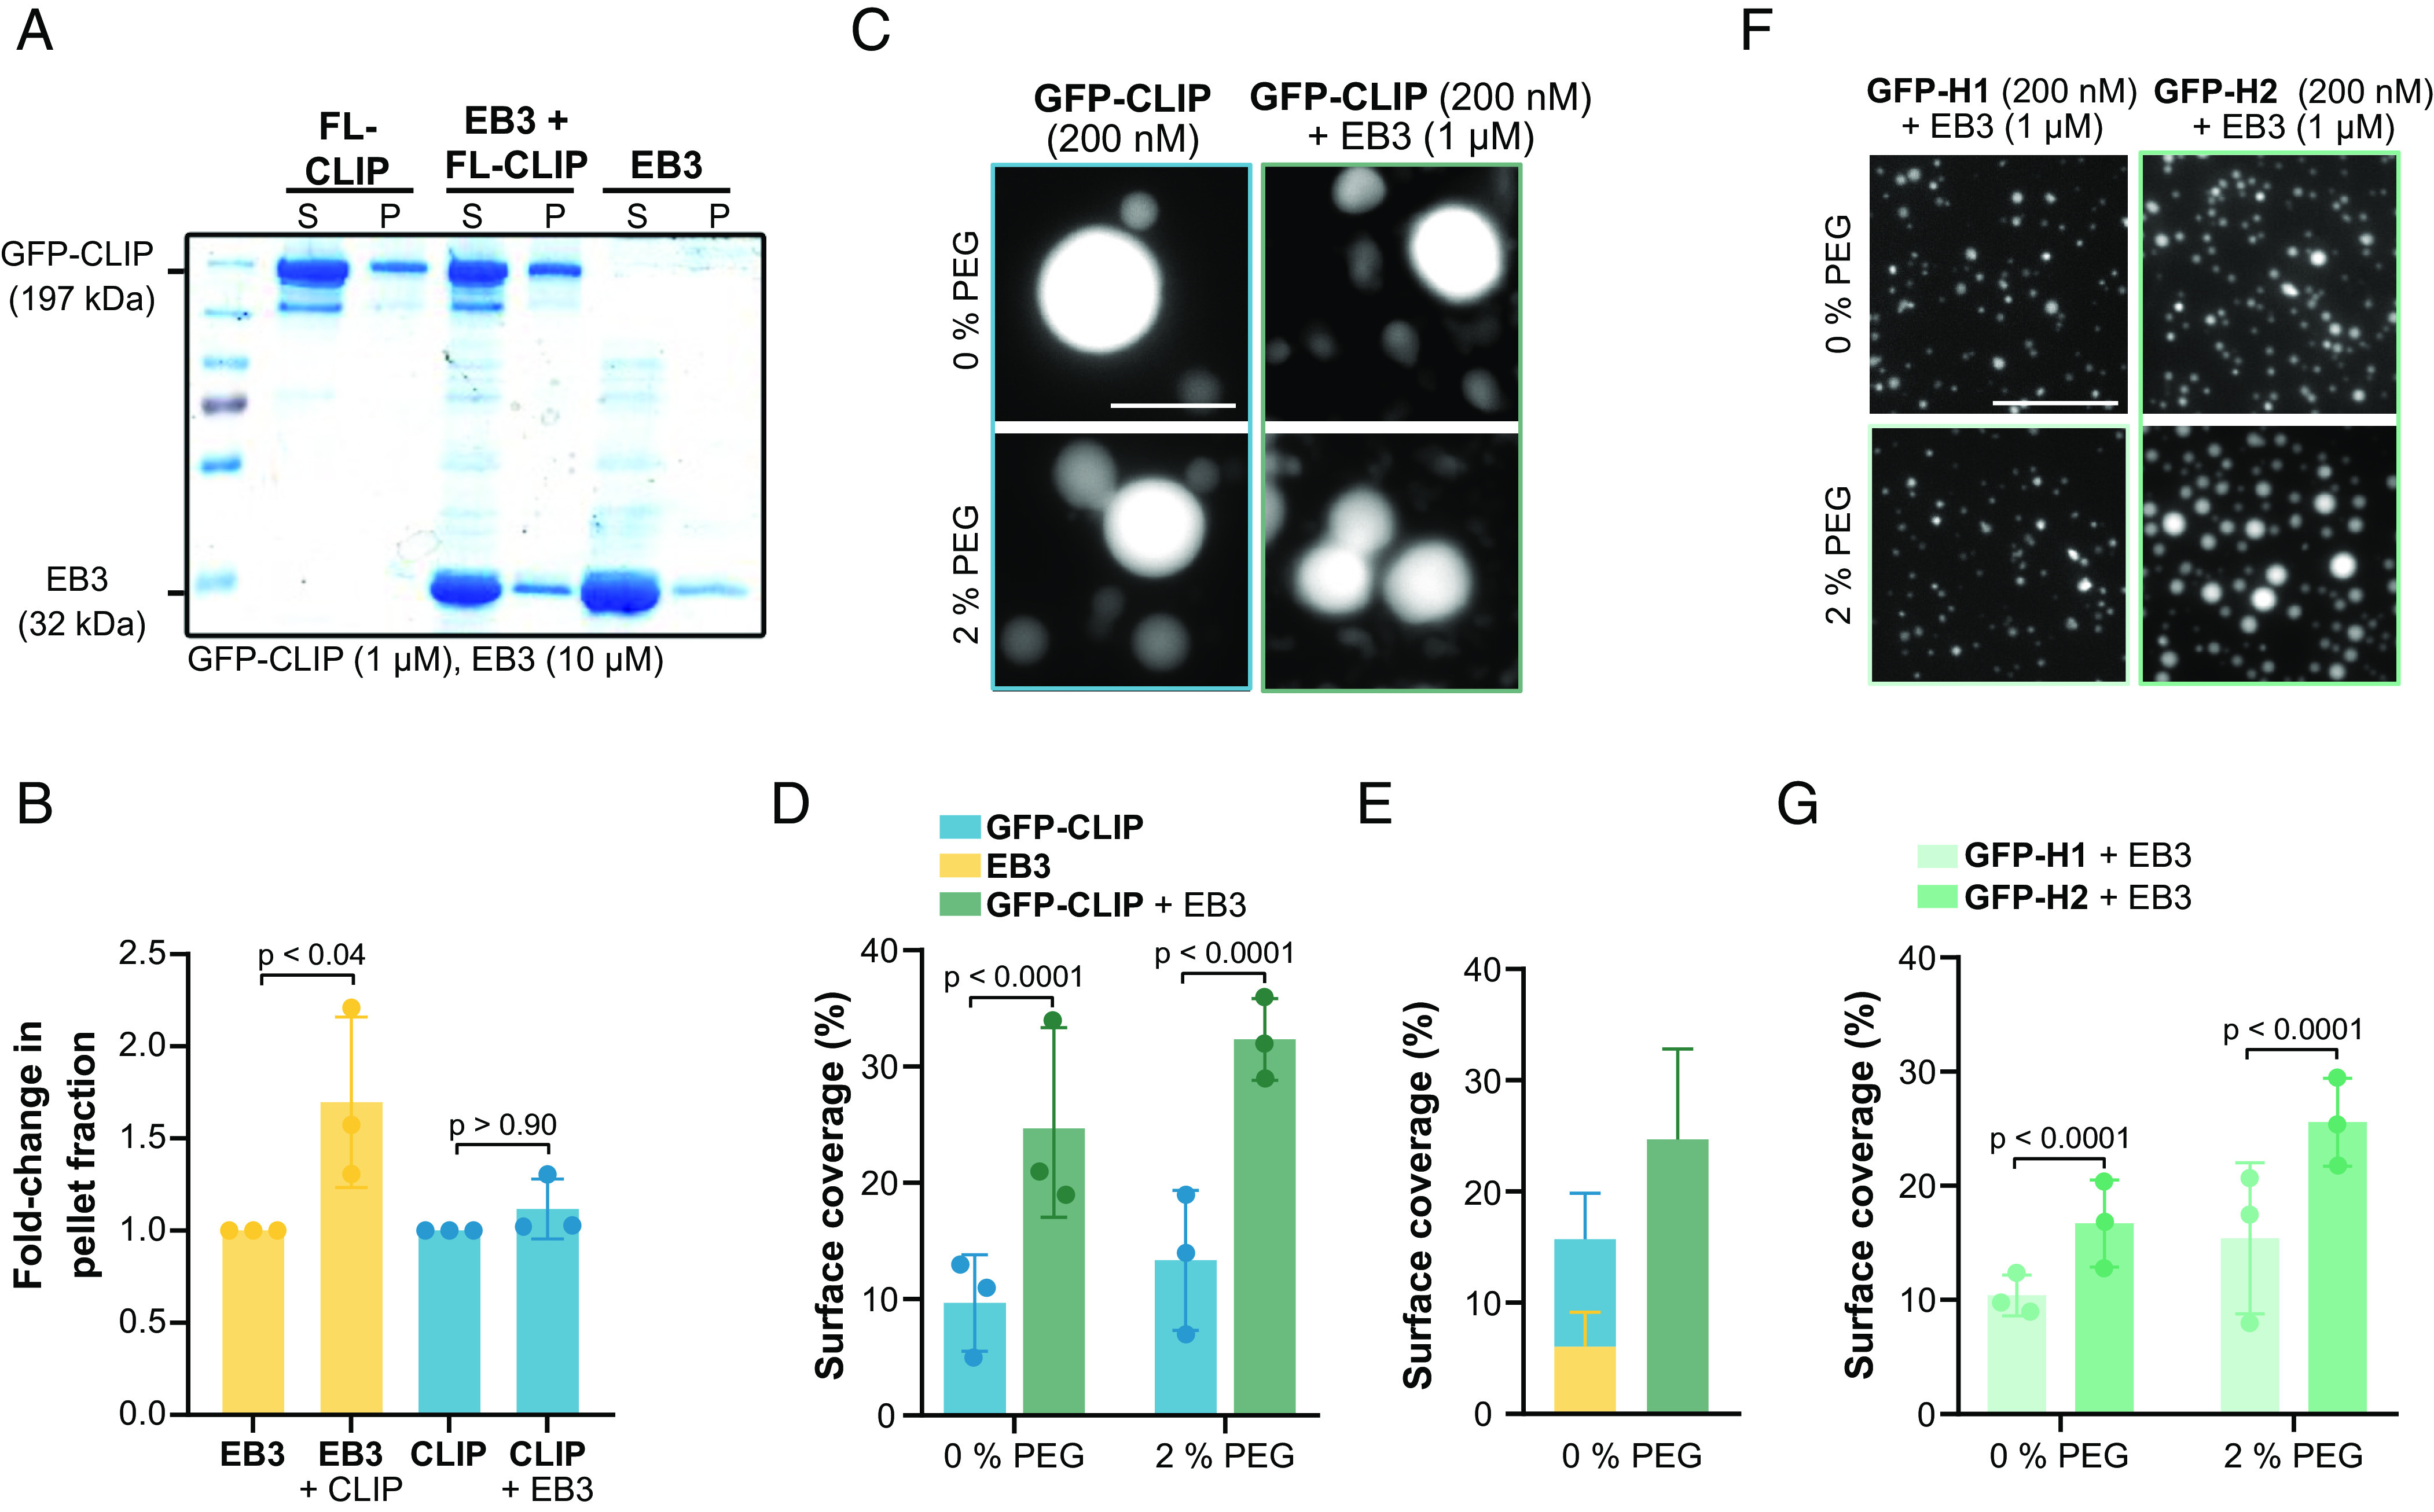
Fig. 4.

Synergistic condensation of CLIP-170 and EB3. (A) Representative SDS-PAGE analysis from the droplet-pelleting assay showing protein fractions in supernatant dilute phase (S) or pellet dense phase (P) under each condition: GFP-FL-CLIP (1 µM); EB3 (10 µM); EB3/GFP-FL-CLIP (10 µM + 1 µM). (B) Quantification of SDS-PAGE analysis showing the fold-change of protein in the pellet fraction at the three conditions. Mean with SD from three independent experiments. Statistics: one-way ANOVA. (C) Representative fluorescence confocal images of purified GFP-FL-CLIP in the absence (Left) or presence (Right) of EB3 and in the absence (Top) or presence (Bottom) of 2% PEG. (Scale bar: 20 µm.) (D) Condensate surface coverage of purified GFP-FL-CLIP (200 nM) in the absence (Left) or presence (Right) of EB3 (1 µM) at indicated PEG concentrations. Mean with SD from three independent experiments with a total of 27 fields of view. Statistics: two-tailed Student’s t test. (E) Quantification of droplet surface coverage of EB3 (1 µM) and GFP-FL-CLIP (200 nM) alone compared to surface coverage of EB3/GFP-FL-CLIP (1 µM/200 nM) droplet formation when undergoing synergistic LLPS in the absence of PEG. (F) Representative fluorescence confocal images of purified GFP-H1 (Left) or GFP-H2 (Right) in the presence of EB3 and in the absence (Top) or presence (Bottom) of 2% PEG. (Scale bar: 20 µm.) (G) Quantification of condensate surface coverage of indicated GFP-H1 (200 nM) or GFP-H2 (200 nM) in the presence of EB3 (1 µM) and in the presence of the indicated PEG concentrations. Mean with SD from three independent experiments with a total of 27 fields of view. Statistics: two-tailed Student’s t test.
