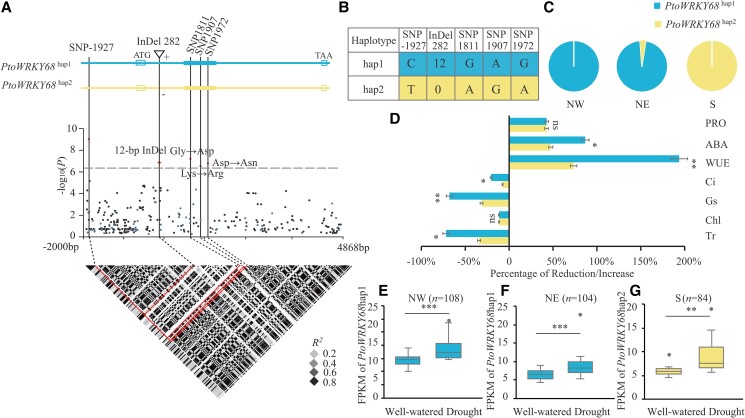
Figure 2.
Natural variation in PtoWRKY68 was significantly associated with drought tolerance in Populus tomentosa. A) Association analysis of genetic variation in PtoWRKY68 with the percentage increase in stomatal conductance (Gs) and the pattern of pairwise LD of DNA polymorphisms. Black dots denote SNPs and blue dots represent insertions and/or deletions (indels). A significant SNP, three nonsynonymous variants, and a 12 bp indel are indicated by dots and a triangle above the horizontal dashed line, respectively, and are connected to the pairwise LD diagram by a dashed line (middle). Red lines (bottom) highlight the strong LD of these variations. B) Haplotypes of PtoWRKY68 among Populus natural variations. The PtoWRKY68 haplotype groups were categorized by these five variants. C) The distribution of PtoWRKY68 haplotypes in Populus climate regions. NW, NE, and S represent northwest, northeast, and southern climate regions, respectively. D) Seven drought-related traits of the PtoWRKY68hap1 and PtoWRKY68hap2 alleles. Transpiration rate (Tr), chlorophyll (Chl), stomatal conductance (Gs), intercellular CO2 concentration (Ci), water-use efficiency (WUE), ABA, and proline (PRO) were measured among 300 Populus genotypes under well-watered and drought-stress conditions. The percentage reduction/increase represents the change in measured traits between the two conditions. Error bars are ± SD; significant differences were determined using the t-test, *P < 0.05, **P < 0.01. ns, no significant difference. E to G) FPKM values of PtoWRKY68 in NW E), NE F), and S G) under well-watered and drought-stress conditions. In box plots, center line represents the median, box limits denote the upper and lower quartiles, whickers indicate the interquartile range, and dots are outliers. n denotes the number of genotypes belonging to each haplotype group. Statistical significance was determined using the t-test, **P < 0.01, ***P < 0.001.

