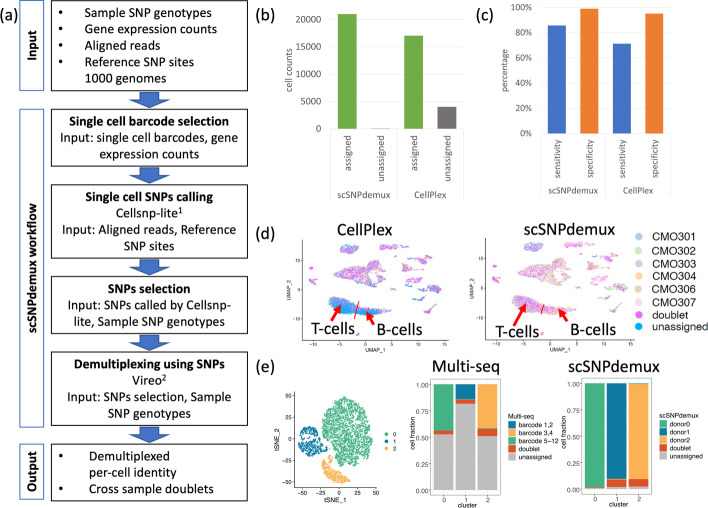
Fig. 1.
a Description of the scSNPdemux workflow. b A barplot summarizing the number of assigned cells independently by CellPlex and scSNPdemux. c The sensitivity and specificity estimation by copy number defined tumour clusters, assuming tumour cells from different patients share a similar copy number profile and form distinct clusters on transcriptome level. d The comparison between CellPlex and scSNPdemux by overlaying the demultiplexed cell labels onto the UMAP. e Comparison of demultiplexing a mixture of Jurkat, HEK293 and HMEC cells by Multi-seq and scSNPdemux. T-SNE map showing three cell types and barplots presenting the fraction of cells assigned. (1) Huang and Huang [2], (2) Huang et al. [3]

