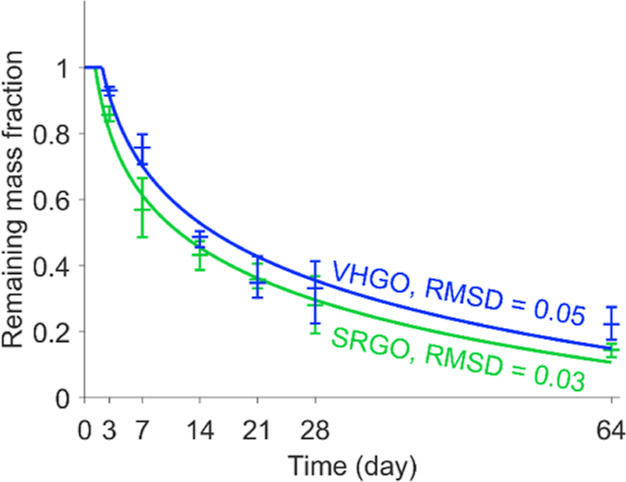
Figure 1.

Remaining total C10+ mass fraction throughout the experiment for VHGO (blue) and SRGO (green) determined by GC × GC–FID. The symbols are the averages of three replicates at each time point (middle horizontal bar) and the range of the three replicates (outer horizontal bars), and the lines are fitted logarithmic decay curves with lag time. The root-mean-squared deviations between the data points and the fitted curves are provided in the figure.
