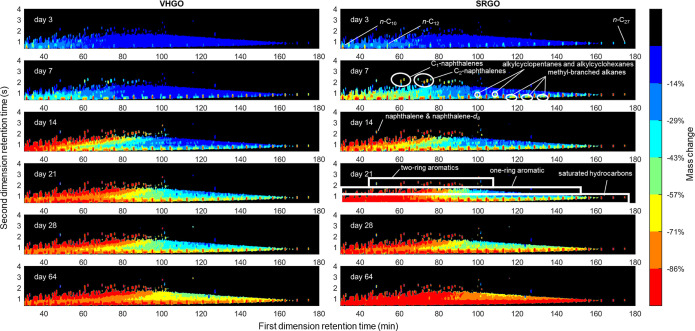
Figure 2.
Percent mass change across the GC × GC–FID chromatogram throughout the experiment, calculated based on the average chromatogram at each time point in the experiment relative to the average chromatogram at day 0 (the average chromatogram is the average of the three replicate chromatograms). To limit noise, only the pixels representing the largest 10% in the day 0 chromatogram are displayed (the remaining 90% of pixels were shaded black), and smoothing was added to the data using a smoothing window of 2 and 10 pixels in the first and second dimensions. The general locations of selected constituents or constituent groups are indicated based on previous literature22,59 and on standard elution times, although it should be noted that other constituents may also occur within the defined constituent groups (see Methods S8 and Table S3, Supporting Information). Note: due to the smoothing applied, naphthalene and naphthalene-d8 overlapped, such that their mass losses are not accurate (naphthalene-d8 is not an oil constituent).

