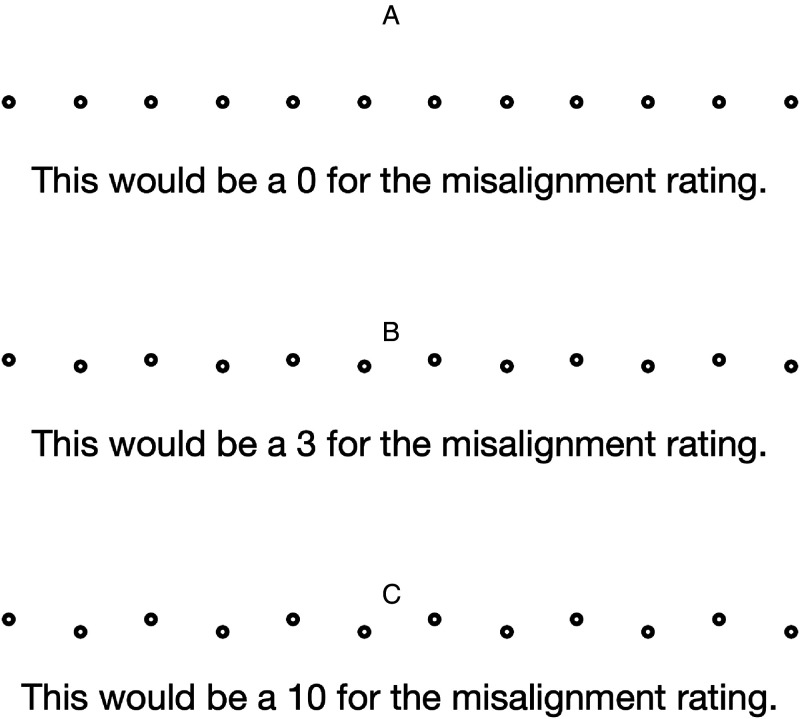
Figure 3.
Participant instruction for misalignment ratings at the onset of the experiment. The illustrated three levels of misalignment (levels 0, 3, and 10) were artificially generated. (A) Example pattern for a misalignment rating of 0. (B) Example pattern for a misalignment rating of 3, and (C) Example pattern for a misalignment rating of 10.

