
Fig 1.
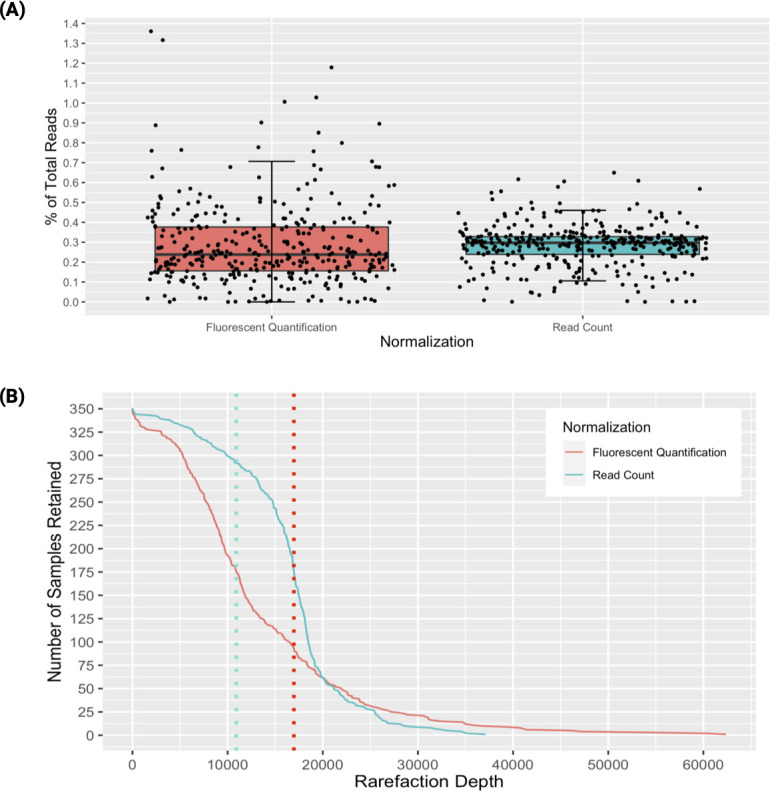
(A) Boxplots showing the distribution of proportions of total reads observed in samples normalized with Fluorescent Quantification and Read Count normalization methods, respectively. Coefficient of variation for Fluorescent Quantification (pink/red) is 0.72. Coefficient of variation for Read Count (turquoise) is 0.37. (B) Rarefaction curve demonstrating the higher sample retention when rarefying to the median number of reads per normalization method. Dotted lines represent the median number of reads per sample for each method.