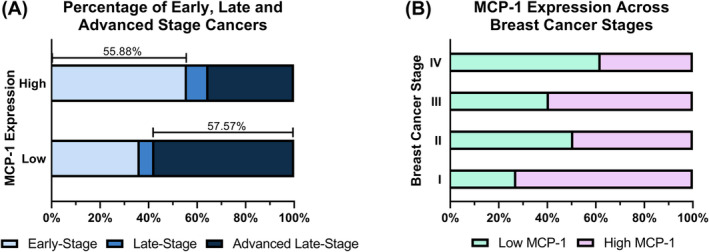
FIGURE 4.

(A) Percentage of low MCP‐1 expression and high MCP‐1 expression groups that were early‐stage (Stage I and II), late‐stage (Stage III) and advanced late‐stage breast cancers (Stage IV). (B) Percentage of low MCP‐1 expression and high MCP‐1 expression cancers in Stage I, Stage II, Stage III and Stage IV cancers. These visual representations were adapted from Hofstee et al. 30 monocyte chemoattractant protein‐1 (MCP‐1).
