. 2023 Jun 16;12(15):16649–16660. doi: 10.1002/cam4.6269
© 2023 The Authors. Cancer Medicine published by John Wiley & Sons Ltd.
This is an open access article under the terms of the http://creativecommons.org/licenses/by/4.0/ License, which permits use, distribution and reproduction in any medium, provided the original work is properly cited.
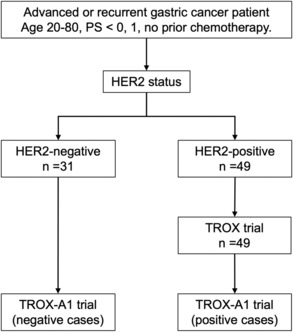
FIGURE 1.

Study flowchart of the TROX‐A1 trial (n = 80).
