
FIGURE 2.
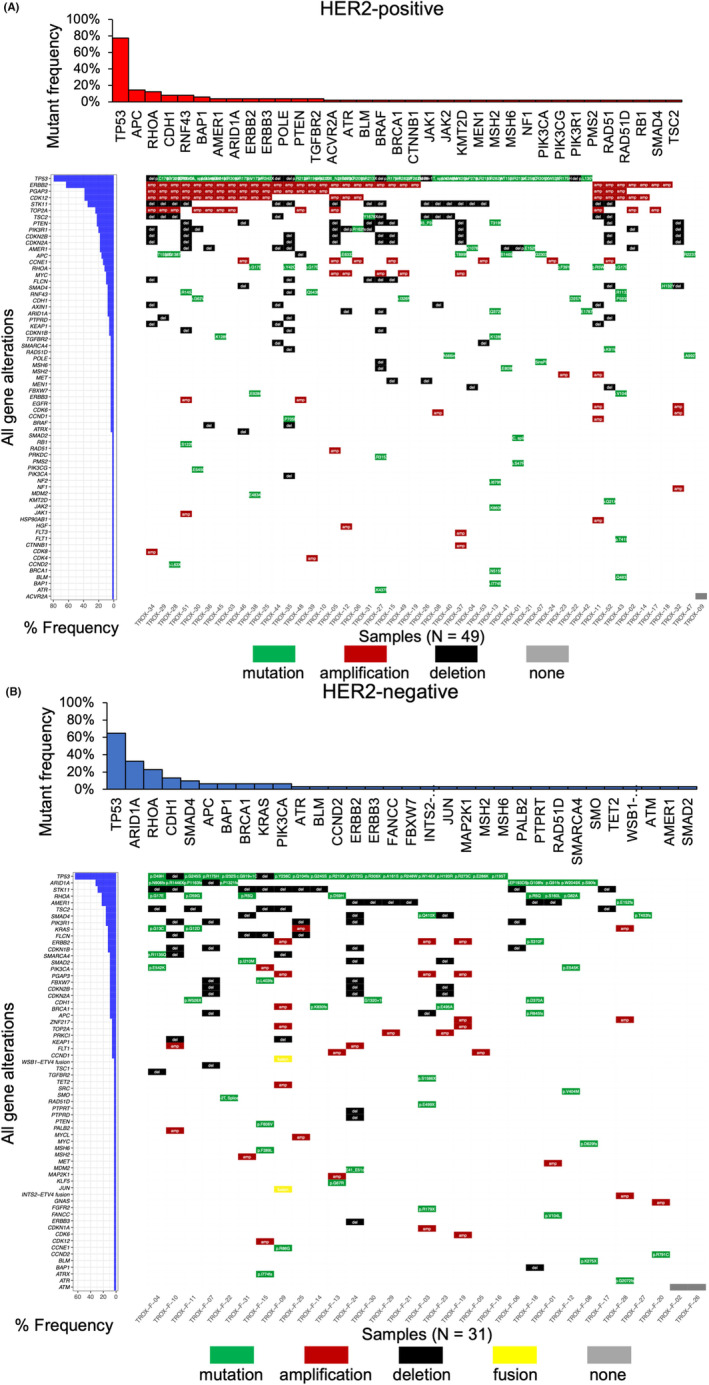
Genomic landscape based on HER2 status in this study (n = 80). Middle panel: All gene alterations identified by CANCERPLEX‐JP are shown in the tile plots. Green represents a mutation with detailed data described in each box; red represents amplification; black represents a deletion; yellow represents a fusion gene; gray represents no gene alterations found. Left panel: Bar plots denote the individual prevalence of all gene alterations. Upper panel: Bar plots denote the individual prevalence of all gene mutations. (A) Molecular characteristics of HER2‐positive gastric cancer patients (n = 49). (B) Molecular characteristics of HER2‐negative gastric cancer patients (n = 31).