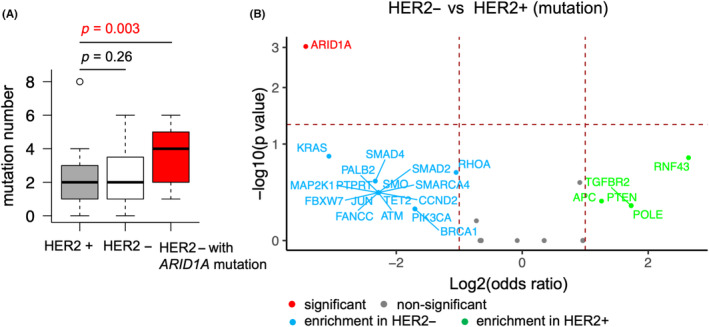
FIGURE 3.

Differences in nonsynonymous mutations between HER2‐positive and HER2‐negative gastric cancer. HER2+, HER2‐positive; HER2‐, HER2‐negative. (A) The numbers of mutations in HER2‐positive patients (n = 49), HER2‐negative patients (n = 31), and HER2‐negative patients with ARID1A mutation (n = 10) are shown in the boxplot. Mann–Whitney U test p‐value <0.05 is shown in red. (B) Volcano plot showing the enriched gene mutations in HER2‐positive (n = 49) and HER2‐negative (n = 31) gastric cancer patients. The horizontal madder red line denotes a p‐value of 0.05, and the two vertical madder red lines denote a log2 odds ratio (OR) of 1. Only the genes that have log2 OR >1 are annotated. Fisher's exact tests were performed, and the genes with p < 0.05 are annotated in red.
