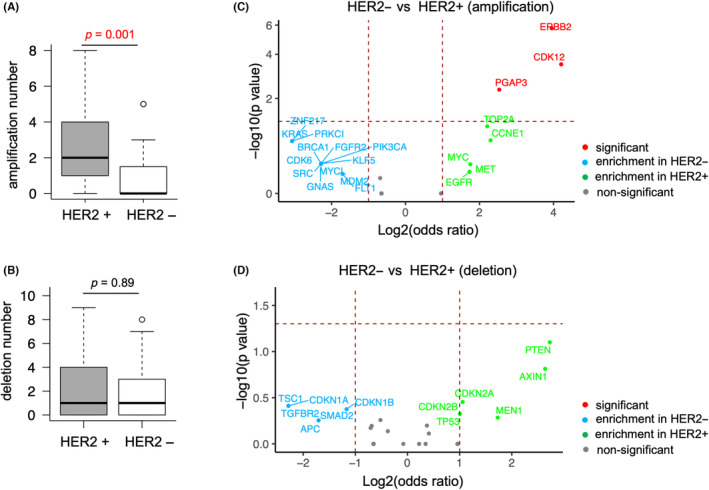
FIGURE 4.

Differences in copy number variations (CNVs) between HER2‐positive and HER2‐negative gastric cancer patients. HER2+, HER2‐positive; HER2‐, HER2‐negative. The horizontal madder red line denotes a p‐value of 0.05, and the two vertical madder red lines denote a log2 odds ratio (OR) of 1. Only the genes that have log2 OR >1 or < −1 are annotated. Fisher's exact tests were performed, and the genes with p < 0.05 are annotated in red. (A) The numbers of amplifications in HER2‐positive patients (n = 49) and HER2‐negative patients (n = 31) are shown in the boxplot. Mann–Whitney U test p‐value <0.05 is shown in red. (B). The numbers of deletions in HER2‐positive patients (n = 49) and HER2‐negative patients (n = 31) are shown in the boxplot. (C) Volcano plot showing the enriched gene amplifications in HER2‐positive and HER2‐negative patients. (D) Volcano plot showing the enriched gene deletions in HER2‐positive and HER2‐negative patients.
