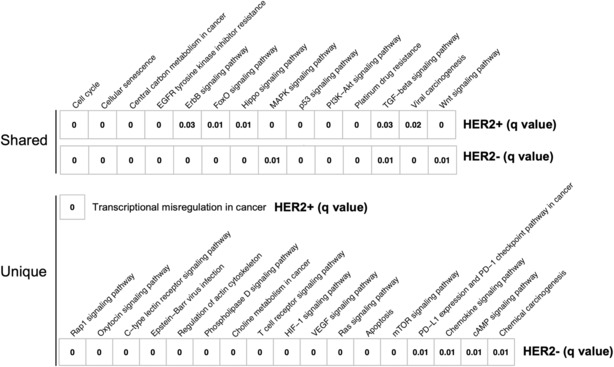
FIGURE 5.

Pathway analyses for the enriched gene alterations in HER2‐positive and HER2‐negative gastric cancer. The FDR‐adjusted p‐value (q‐value) is shown in each box and represents the significance of associations between KEGG pathways and HER2 status. The pathways significantly enriched in both HER2‐positive and negative patients are defined as shared pathways. The pathways only significantly enriched in HER2‐positive or negative patients are defined as unique pathways.
