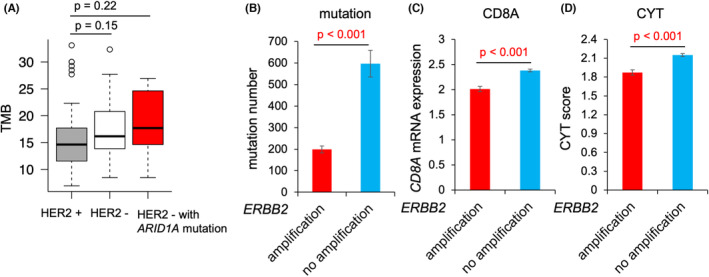
FIGURE 6.

Associations between HER2 status and local immune environment factors. (A) TMB of HER2‐positive patients (n = 49), HER2‐negative patients (n = 31), and HER2‐negative patients with ARID1A mutation (n = 10) are shown in the boxplot. (B) Bar plot showing the total number of mutations in ERBB2‐amplified gastric cancer patients (n = 70) and ERBB2‐nonamplified gastric cancer patients (n = 323) from The Cancer Genome Atlas (TCGA) dataset. Student's t‐test p‐value <0.05 is shown in red. (C) Bar plot showing CD8A mRNA expression levels in ERBB2‐amplified gastric cancer patients (n = 75) and ERBB2‐nonamplified gastric cancer patients (n = 338) from the TCGA dataset. Student's t‐test p‐value <0.05 is shown in red. (D) Bar plot showing the CYT score in ERBB2‐amplified gastric cancer patients (n = 75) and ERBB2‐nonamplified gastric cancer patients (n = 338) from the TCGA dataset. Student's t‐test p‐value <0.05 is shown in red.
