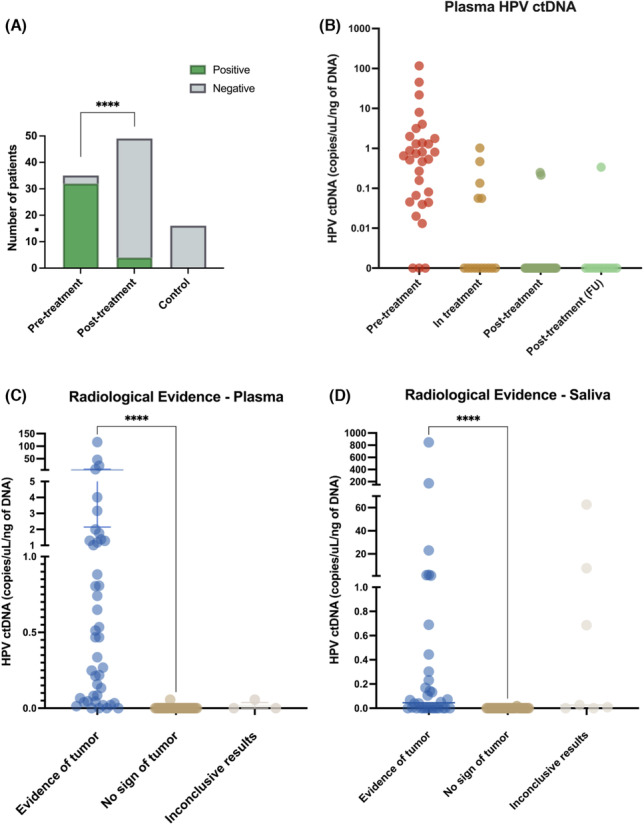
FIGURE 3.

ctDNA levels are significantly higher before treatment and correlate to treatment response. (A) ctDNA detection by PCR for HPV16/18/33 sequences shown for pre‐ and post‐treatment samples, χ 2 p < 0.0001. (B) ctDNA levels (copies/μL/ng of DNA) shown according to treatment stage. Levels of HPV‐ctDNA (copies/μL/ng of cfDNA) categorized by evidence of tumor in either pathological analysis or imaging for ≥6 months post sample collection for (C) plasma and (D) saliva., Mann Whitney p < 0.0001 for patients with and without radiological evidence of tumors.
