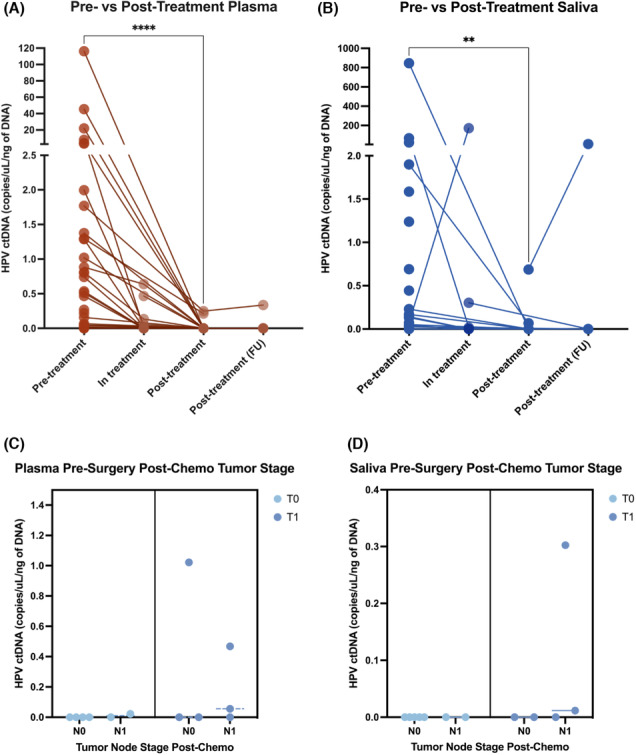
FIGURE 4.

ctDNA levels decrease significantly post treatment. Pre‐treatment vs post‐treatment HPV–ctDNA levels for patients for (A) plasma and (B) saliva. Statistical comparison for pre‐ vs. post‐treatment ctDNA levels performed using a Wilcoxon matched pairs signed rank test (****p < 0.0001, **p < 0.01). Patients were classified as “in‐treatment” if they had received neoadjuvant chemotherapy prior to surgery or diagnostic positive margin surgery which received later revision. Levels of ctDNA in (C) plasma and (D) saliva in patients post‐chemotherapy based on staging from pathological analysis in surgical tissue.
