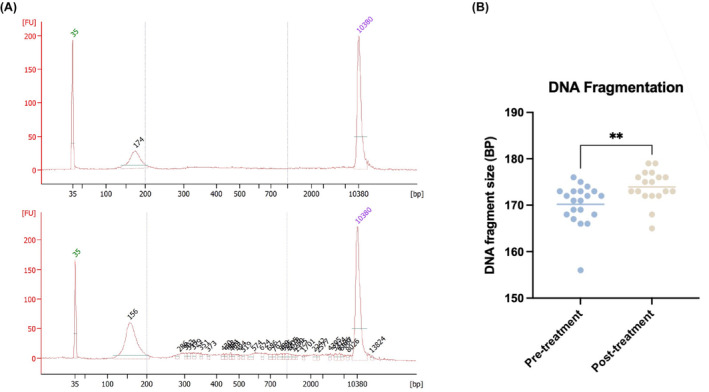
FIGURE 5.

cfDNA fragment size increases post‐treatment. (A) Representative bioanalyzer results for plasma samples from 2 patients (B) Plasma DNA fragment size for matched pre‐and post‐treatment samples. Dominant fragment size chosen as fragment length with the highest concentration in plasma cfDNA using the Agilent Bioanalyzer 2100. p = 0.0035, paired t‐test.
