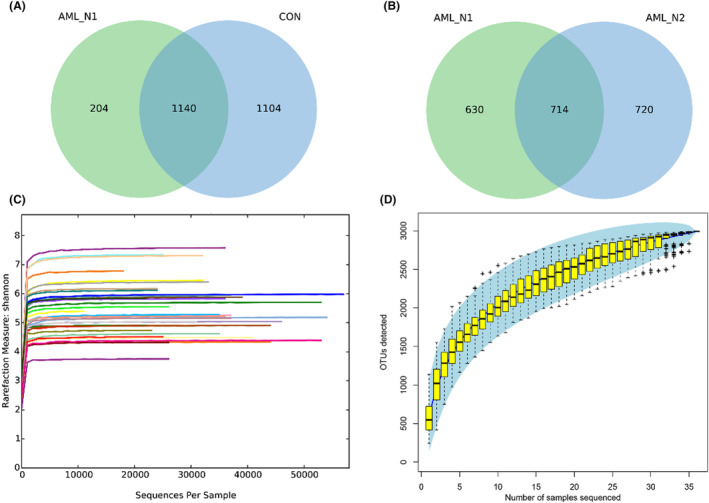
FIGURE 1.

Adequate sequencing and sampling. (A) Venn diagram shows the unique and shared OTUs in AML_N1 and CON groups. (B) Venn diagram shows the unique and shared OTUs in AML_N1 and AML_N2 groups. (C) The rarefaction curves of Shannon index of each sample. (D) Specaccum curve of all fecal samples. CON group, Normal control; AML_N1 group, newly diagnosed AML patients; AML_N2 group, Newly diagnosed AML patients treated with chemotherapy.
