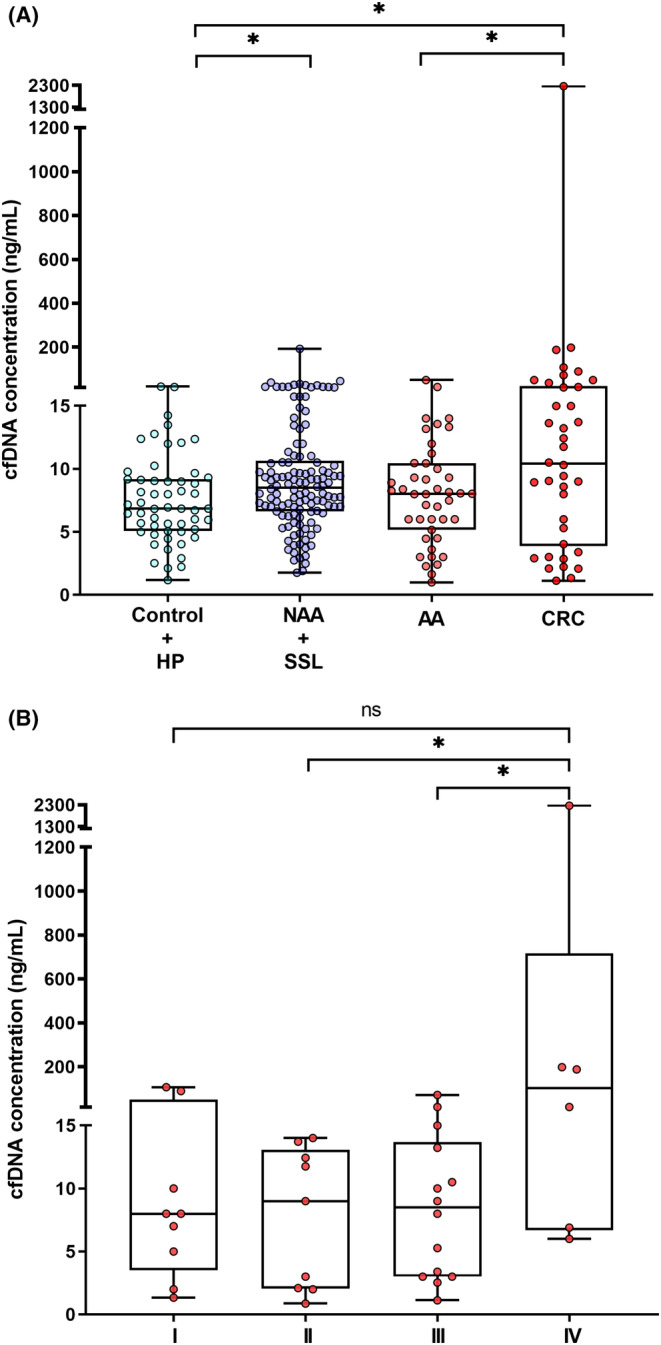
FIGURE 2.

cfDNA concentration (ng/mL) according to: (A) Lesion group (Kruskal–Wallis test; p = 0.030) and (B) Tumor stage (I–IV). (Kruskal–Wallis test; p = 0.049). Mann–Whitney U‐test to compare two groups; * p < 0.05. AA, advanced adenoma; cfDNA, cell‐free DNA;CRC, colorectal cancer; HP, hyperplastic polyp; NAA, nonadvanced adenoma; ns, not significant; SSL, sessile serrated lesion.
