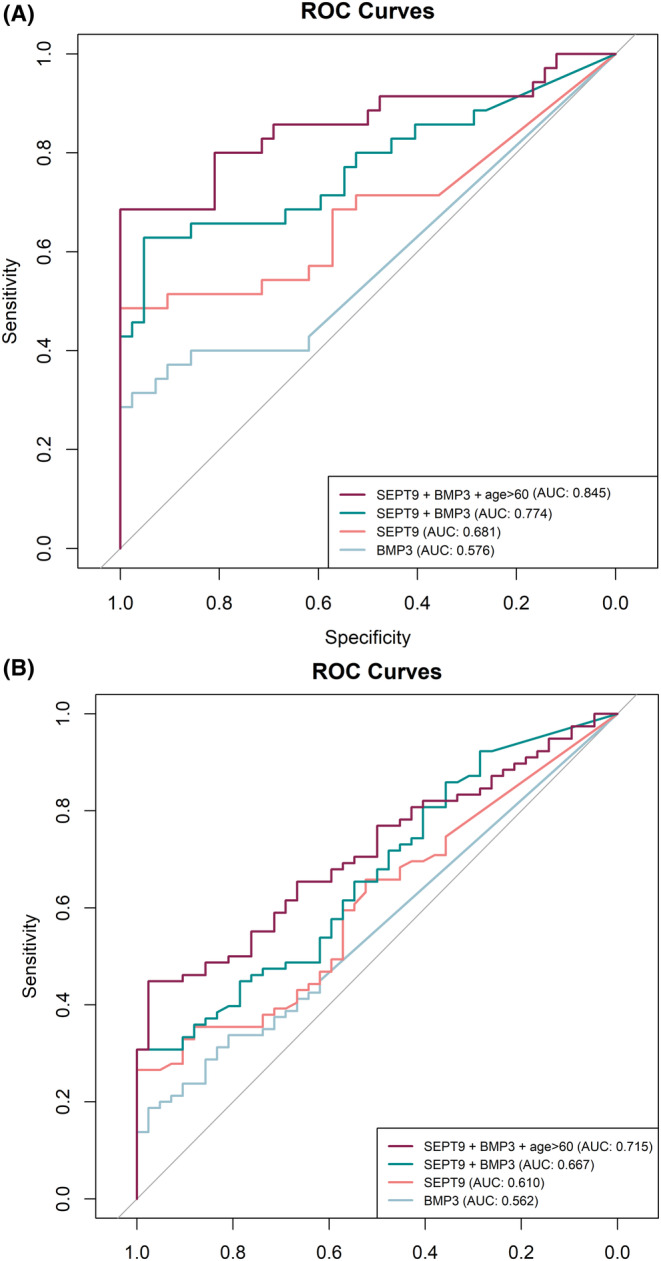
FIGURE 5.

Comparison of ROC Curves (A) for CRC (n = 35) diagnostic of SEPT9 (AUC = 0.681; CI = 0.544–0.794) and BMP3 (AUC = 0.576; CI = 0.452–0.690) methylation. Combination of SEPT9 + BMP3 (AUC = 0.774; CI = 0.662–0.886) and SEPT9 + BMP3 + age > 60 (AUC = 0.845; CI = 0.767–0.943). (B) for Advanced adenoma (n = 44) + CRC (n = 35) diagnostic of SEPT9 (AUC = 0.610; CI = 0.510–0.710) and BMP3 (AUC = 0.562; CI = 0.470–0.654) methylation. Combination of SEPT9 + BMP3 (AUC = 0.667; CI = 0.569–0.765) and SEPT9 + BMP3 + age > 60 (AUC = 0.715; CI = 0.625–0.805). AUC, area under the curve. CI, confidence interval.
