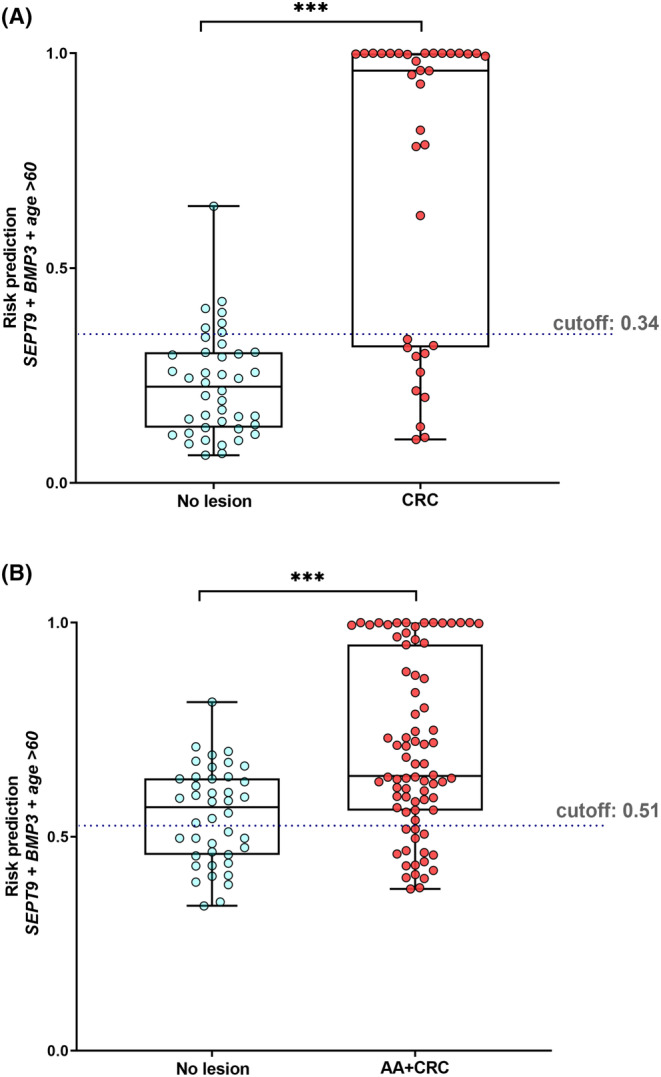
FIGURE 6.

The risk score prediction. (A) no lesion group (Control group, n = 42) and CRC stage I–IV (n = 35) patients. (B) no lesion group (Control group, n = 42) and AA + CRC (n = 79) patients. Mann–Whitney U‐test to compare between two groups; ***p < 0.001.
