Fig 1.
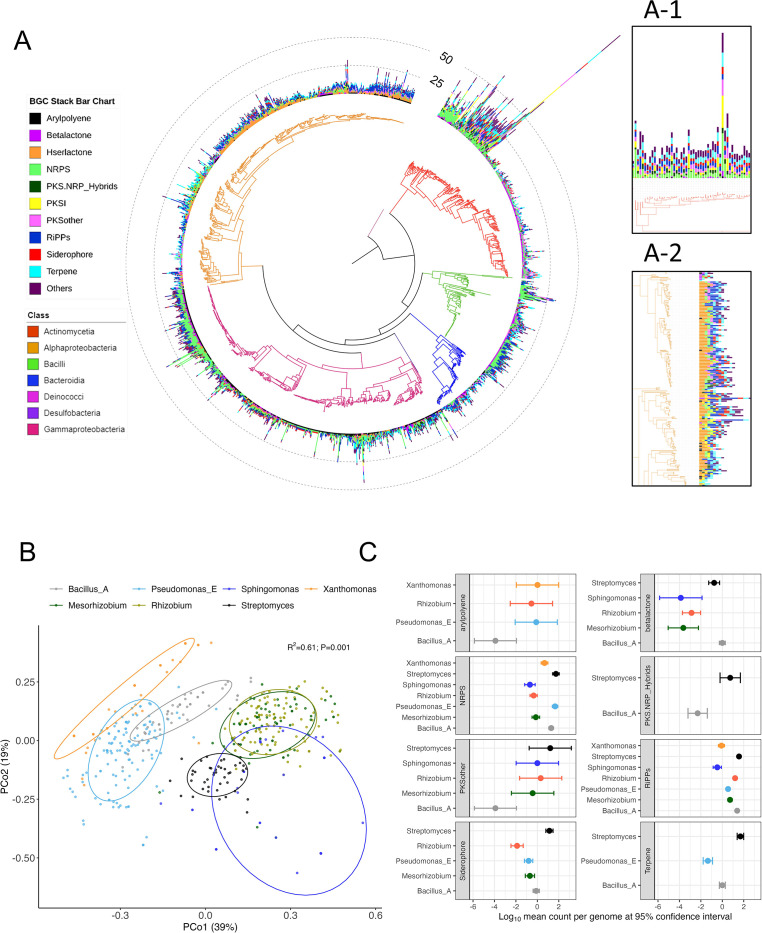
Phylogenetic distribution of BGCs in plant isolates. (A) Phylogenetic tree displaying distribution of BGCs among members of plant isolates. Stacked bars in the outer rings indicate the count of different BGCs (shown in different colors) encoded by individual members. Taxonomic information (at the class level) is shown in colors of the phylogenetic tree branches. Inset A-1 highlights that Actinomycetes phylum possess overall higher number of BGCs and inset A-2 highlights that Alphaproteobacteria encode higher number of hserlactones in their genomes. (B) Principal coordinate plot based on BGC profile dissimilarity of genomes of plant isolates. Ellipses show the parametric smallest area around the mean that contains 80% of the probability mass of each genus. Statistical significance was calculated based on PERMANOVA. Taxonomic groups occupy distinct regions of the biosynthetic space as indicated by distinct clusters of members of each genus. Data have been shown for the top 7 abundant genera in plant isolates. (C) Forest plot displaying differential enrichment of BGC categories among the top 7 abundant genera in plant isolates. The log10 mean count per genome (dots) and 95% confidence interval (upper and lower bars) are shown only for differentially abundant (negative binomial; P < 0.05) BGC categories relative to Bacillus_A.

