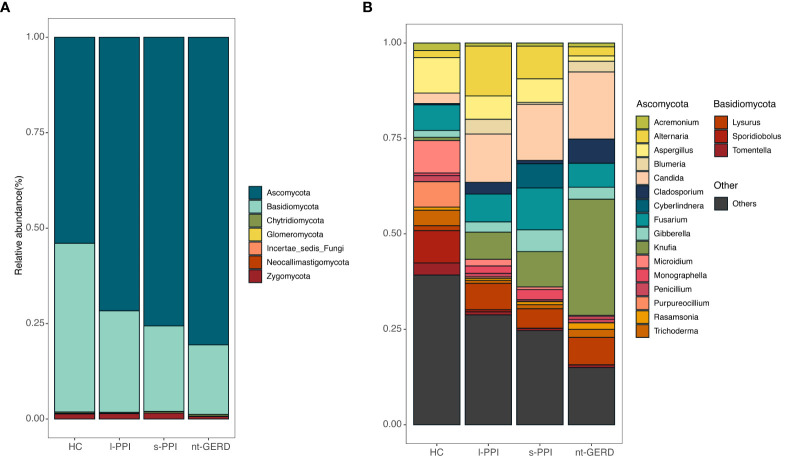
Figure 4.
Stacked bar-plot representation of fecal mycobiota composition in nt-GERD, s-PPI, l-PPI, and HC with taxonomic features collapsed at the level of phyla and genera. (A) The composition of the fungi community at phylum levels among the groups. (B) The composition of the fungi community at genus levels among the groups. Only the top 20 taxa with the largest average relative abundance are listed.

