FIGURE 1.

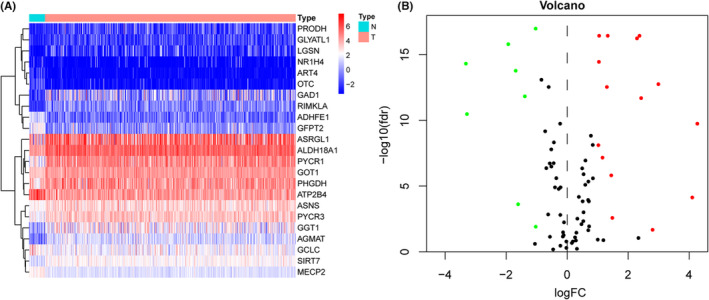
Identification of differently expressed glutamine metabolism‐related genes in EC. The heatmap (A) and volcano plot (B) for DEGs where red and green dots represent upregulated and downregulated genes.

Identification of differently expressed glutamine metabolism‐related genes in EC. The heatmap (A) and volcano plot (B) for DEGs where red and green dots represent upregulated and downregulated genes.