
FIGURE 2.
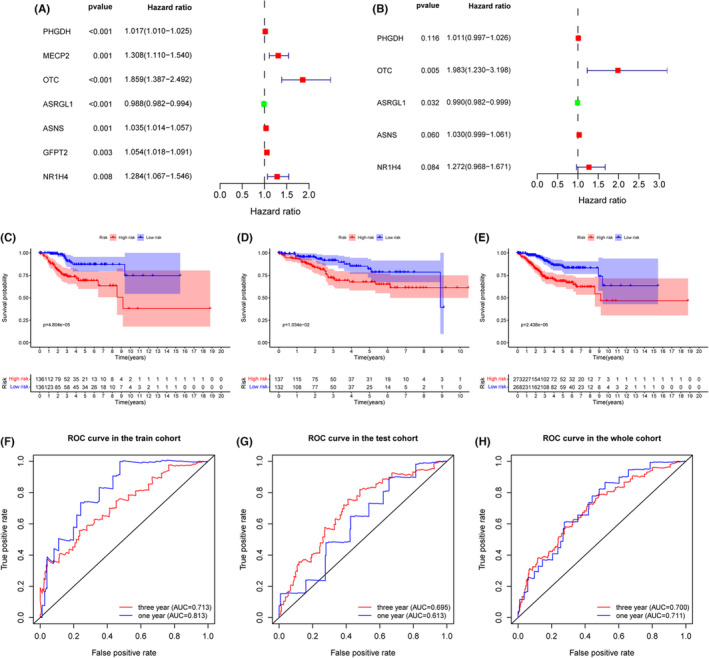
Univariate and multivariate Cox regressions to recognize independent prognostic glutamine metabolism‐related genes of EC in the training cohort. Kaplan–Meier survival and ROC curve were performed to validate the predicting efficacy of the prognostic signature. (A) Univariate Cox analysis. Hazard ratio (HR) >1 indicates that exposure is a risk factor, and HR <1 indicates that exposure is a protective factor. (B) Multivariate Cox analysis. (C–E) Kaplan–Meier survival for EC patients of high‐ and low‐risk groups in the training cohort, testing cohort, and the entire cohort, respectively. (F–H) ROC curves based on the prognostic signature in the training cohort, testing cohort, and the entire cohort respectively.