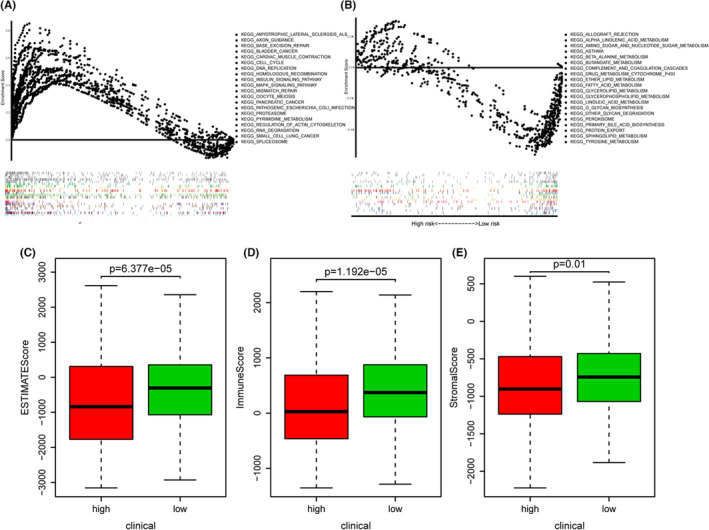
FIGURE 5.

Cancer signaling pathways and tumor immune environment in different risk groups stratified by glutamine metabolism‐related prognostic model. The GSEA analysis of DEGs between two risk groups. KEGG enrichment of high‐risk group (A) and low‐risk group (B). The distribution of (C) estimation scores, (D) immune scores, and (E) stromal scores in high‐ and low‐risk groups.
